Bar chart
On a bar chart, categories (label column) are presented on the horizontal axis, and the series values (data series) are spread on the vertical axis.
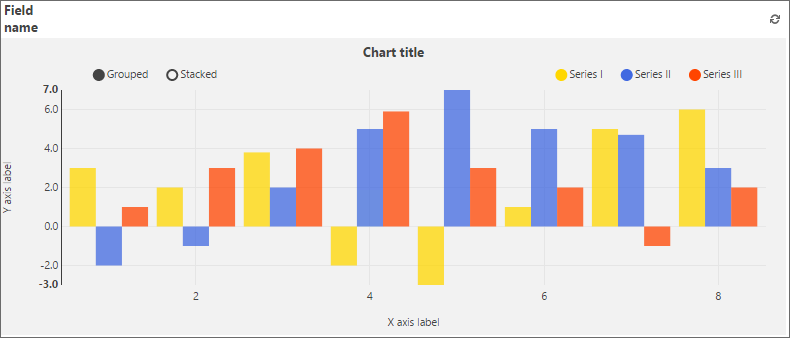
The location of the title and axis labels in the Bar chart is shown on the screenshot above.
The Grouped and Stacked buttons on the top left part of the form field switch display modes for multiple data series.
The first (default) option displays each series as a separate bar and they are placed adjacent to one-another on the corresponding category.
Stacked view accumulates all series for each category into a single segmented bar with each segment’s size being proportional to its value.
By default, all data series selected in the chart’s Advanced configuration are visible. They can be hidden/shown by clicking the legend’s icons.
- a single click hides the selected series,
- double-clicking on a series hides every other series except the selected one,
- if only one series is left visible, clicking it once quickly returns to the default view (all series visible).