Reports
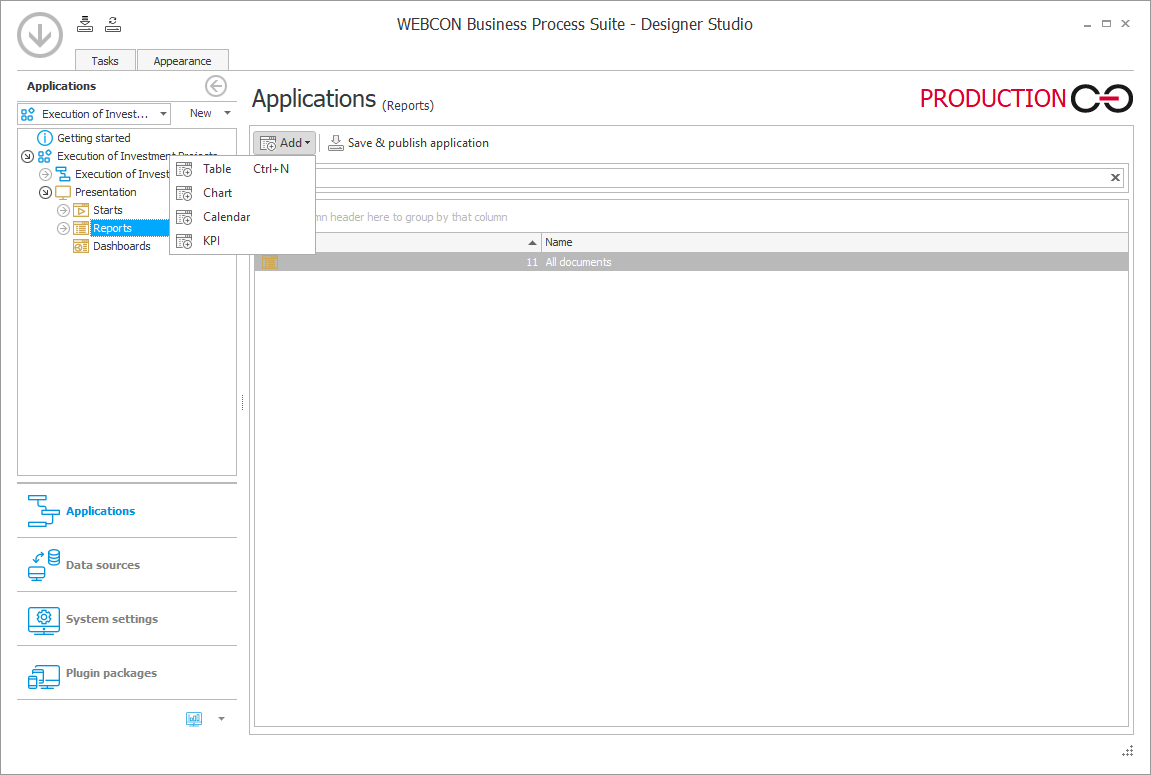
Report is a summary of data from selected workflow instances created in the system. The data presented in the report can be as concise or elaborate as necessary. In its most basic mode, the report will take the form of a table containing workflow instances in the Content database (the visible columns and range of displayed data are fully configurable). Reports and their views can be created both in Designer Studio and in Portal.

In WEBCON BPS, you can choose from the following three report types:
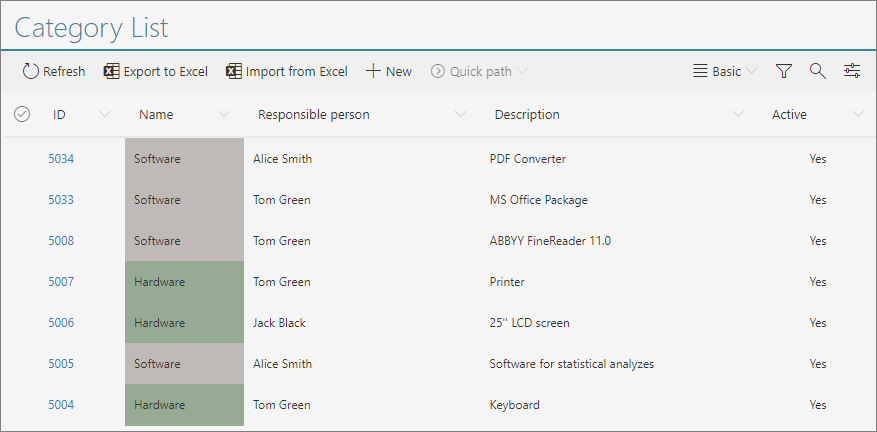
Table
Report in the form of a table collating information gathered from filled out forms. The table columns are the system or process form fields selected by the user, while the workflow instances are its rows.

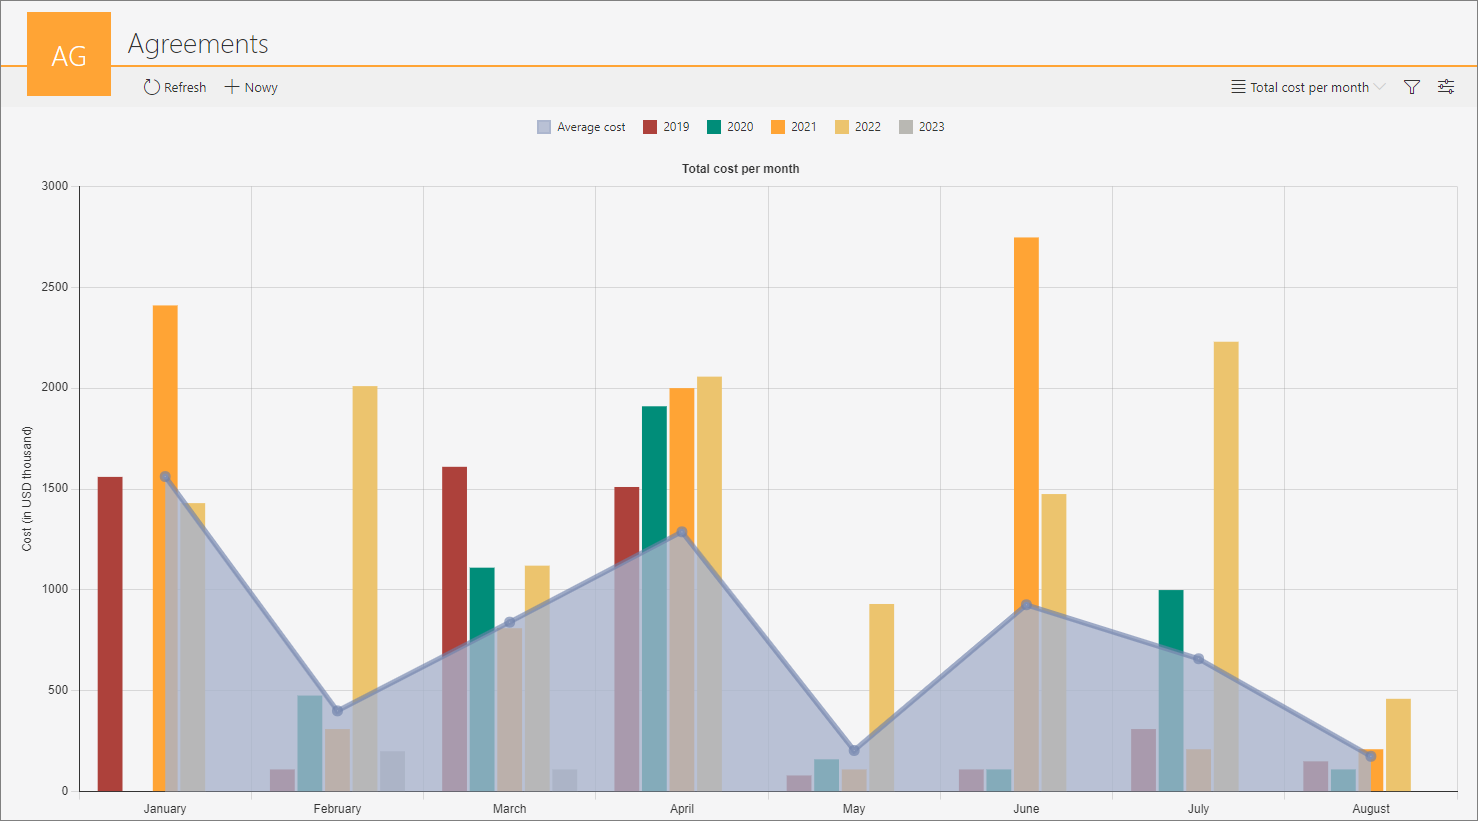
Chart
Report in the form of a chart, where the X axis is the categories defined by the user based on the selected process or system form fields, and the Y axis usually represents the numerical values with which these fields are filled in. In the case of the Horizontal bar chart, the arrangement of the axes is reversed.

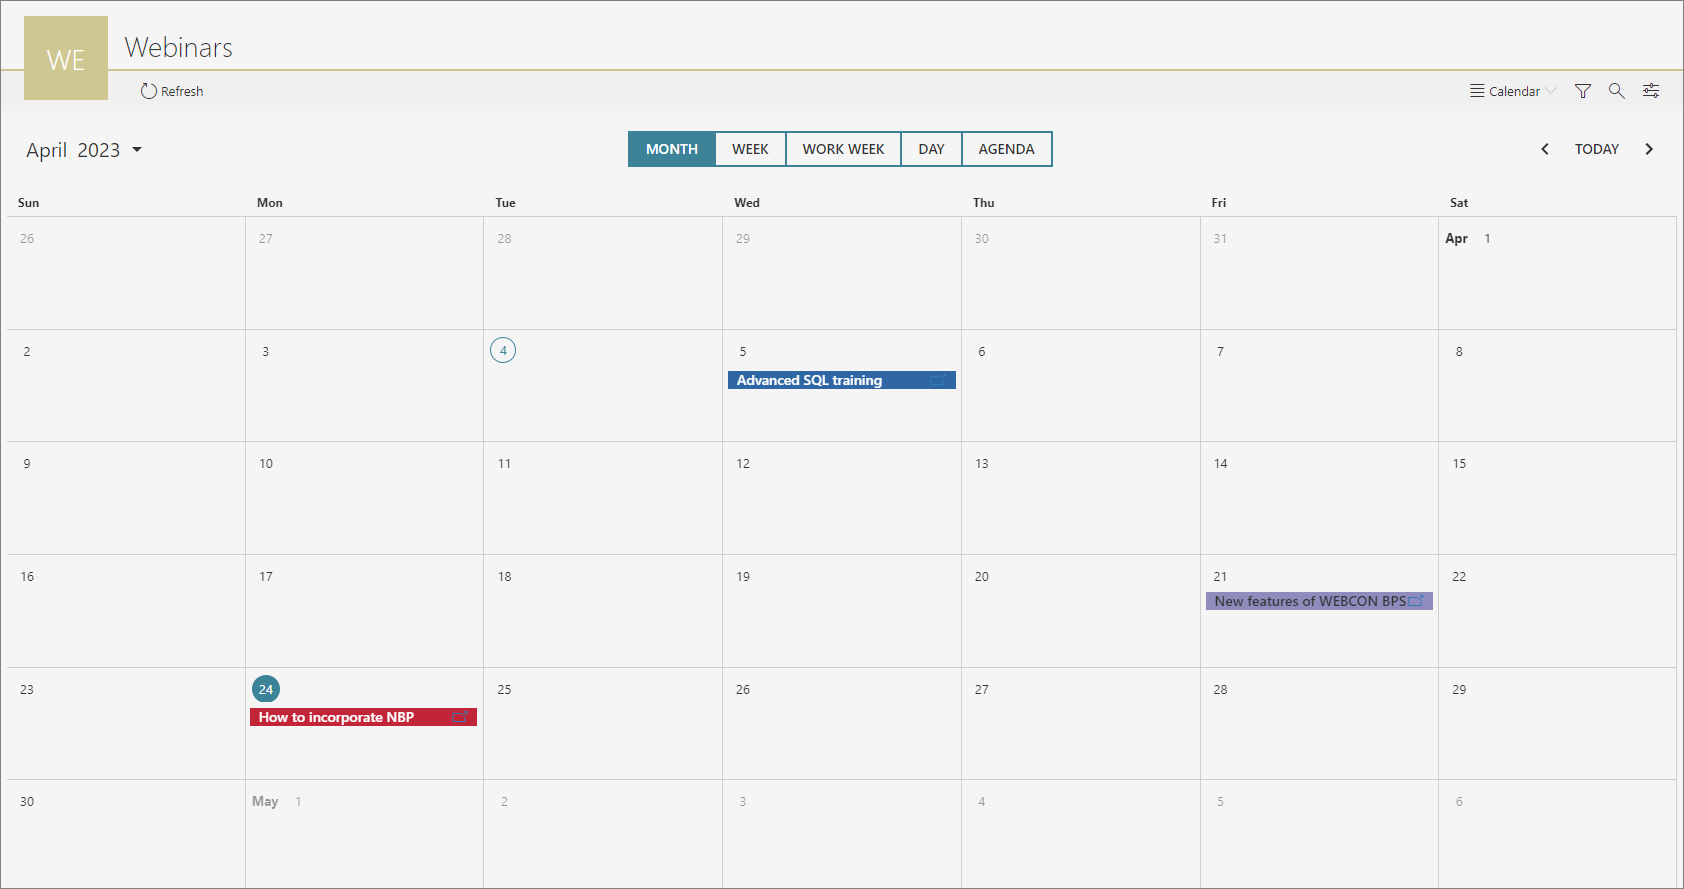
Calendar
Calendar is a report in which workflow instances are displayed in the form of events marked on a calendar. This report can be created if a workflow instance contains at least one Date or time form field.

KPI
Used to graphically present performance indicators defined on each step of the workflow. The report configuration allows you to specify a process and type of indicator (edition statistics or time spent in each step). Data are presented in the form of colorful indicators grouped by workflow, step, or user. Reports are based on statistics that are constantly updated, and therefore require the process to be configured correctly – the Analysis tab of each workflow step needs to be set up, and the Basic functionalities role needs to be active for WEBCON BPS Workflow Service.

You can learn more about creating and configuring reports HERE, while additional information about KPIs is available in THIS ARTICLE on our technical blog.