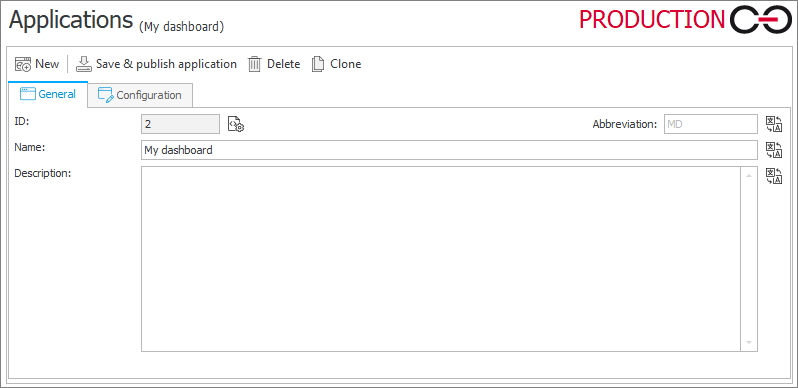
Dashboards
Dashboards allow you to create useful pages for your end users that contain customized clusters of information, including Reports, start buttons, images, formatted text, and embedded elements.
The layout and complexity of data shown on a dashboard can be customized to suit the needs of individual users:
-
End users may require less complex and more user-friendly dashboards featuring simple reports of all tasks assigned to them, several start buttons for most frequently used applications, and a selection of links to useful pages and instructions.
-
Power users may require more elaborate dashboards containing multiple reports and various types of Views, providing them with detailed information on all activities in the system.
Configuration
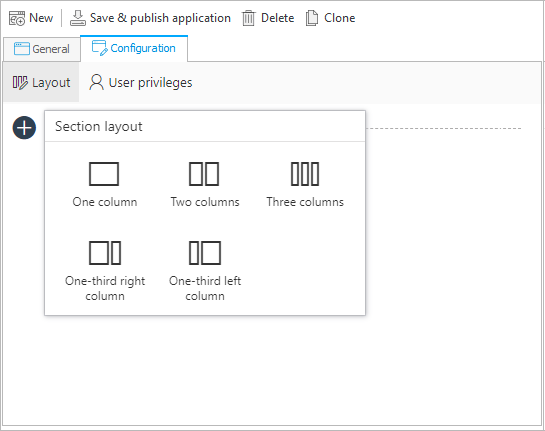
Each dashboard is built out of sections that can be stacked on top of each other. To add a section, click on the "+" icon on the left. There are 5 different dashboard layout options to choose from:
After selecting the section layout, hover over and click on the "+" icon in a column to add an element to the dashboard. Choose one of the available elements:
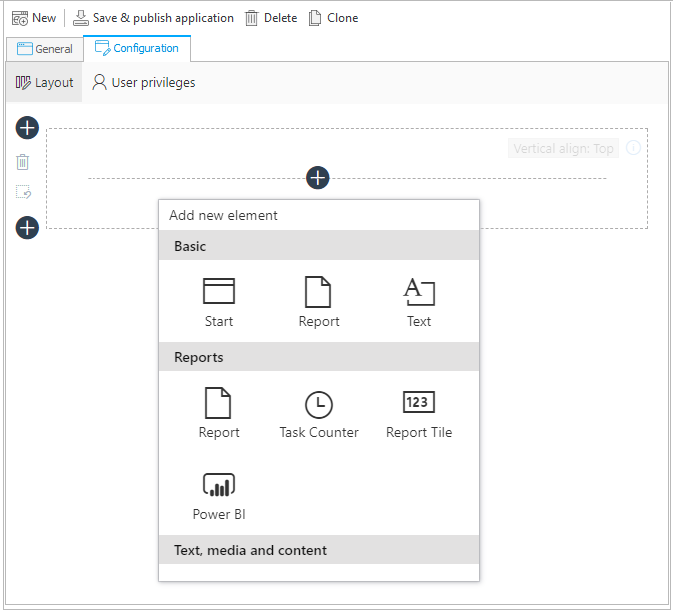
Below you will find a concise overview of available elements.
Basic
- Start – one of your configured start buttons
- Report – one of your configured report views
- Text – a text field with various formatting options
Reports
- Report – one of your configured report views
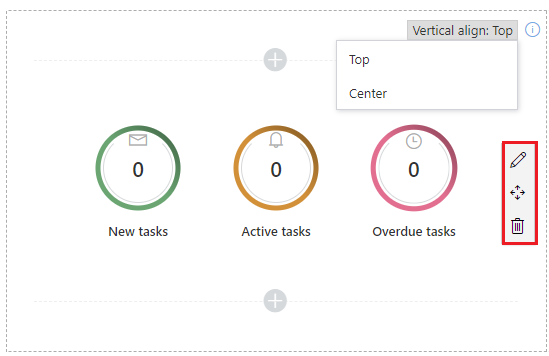
- Task Counter – displays three pieces of information about application tasks (New tasks, Active tasks, Overdue tasks)
- Report Tile – displays aggregated values from a selected field
- Power BI – the ability to display a Power BI report. To correctly operate Power BI reports embedded in WEBCON BPS Portal, provide the correct application ID in the System settings
You can read more about embedding Power BI reports in WEBCON BPS dashboards HERE.
Text, media and content
- Text – a text field with various formatting options
- Image – an image (you need to provide image URL)
- Embedded element – used to add elements such as an HTML table, YouTube movie or an RS Report
- HTML code – used to enter am HTML code
Miscellaneous
- Refresher – automatically refreshes the dashboard in the selected time interval
- Find instance – allows searching for an element by its ID, number, or both
- Application description – a short description of an application
- Recent activities – displays recent activities
- Application supervisor – displays the application's supervisor
- Suggested reports – displays suggested reports
- Act on behalf – allows one user to perform tasks on behalf of another
For each dashboard column, you can change the vertical alignment of the embedded elements to position them on top or in the center of the column. You can place any number of elements in a column.
If you want to move an element to another column/section or arrange elements in a different order, hover over the element you want to move. After that, a vertical menu with three options will be displayed on the right. Click and hold the middle button in the menu to drag and drop the element to the desired location on the dashboard.
Click on the pencil icon and check the dedicated box to set the Custom margin for the element, i.e. to freely position it relative to other dashboard elements. A window will then appear where you can define the individual element margins by entering their values in pixels.
By going to the User privileges tab, you can decide whether the visibility of the dashboard will be Inherited from application or Custom (the dashboard will be visible only to the designated users.)
For more information and examples of dashboard configuration, see our extensive article on Dashboards.