Analysis
The Analysis tab available in the step configuration window contains statistical information on the time an instance remained in a given step and its real edition time. Additionally, the tab provides a tabular summary divided into the following columns:
- User
- Average time in step,
- Average time in step (last month),
- Average time in step (previous month),
- Average time in step (current year),
- Average time in step (previous year),
- Trend.
The averaged data is presented for each process user. Based on the expected times (in-step and edition time), the system presents time evaluations:
 time below expected,
 time below expected, but close to it,
 time longer than expected.
The trend is a difference between the time in the current and previous month.
 duration shorter than in the previous month,
 duration comparable to the duration in the previous month,
 duration longer than in the previous month.
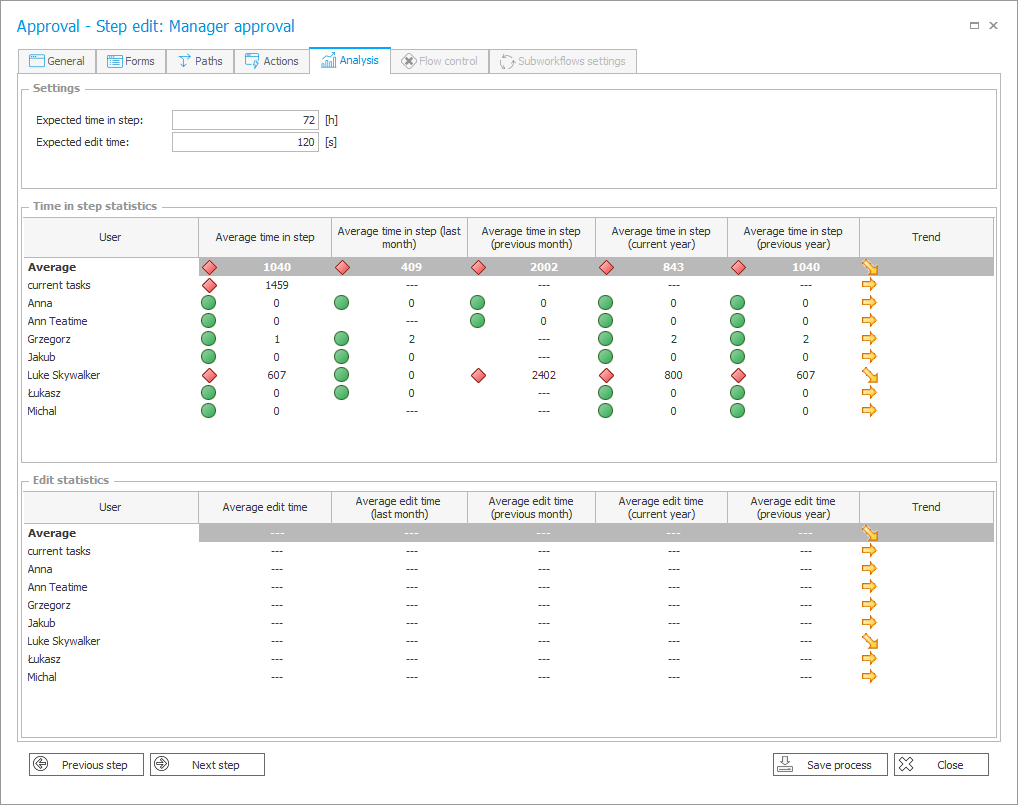
In the graphic chart those analyses are additionally presented in a shortened form.
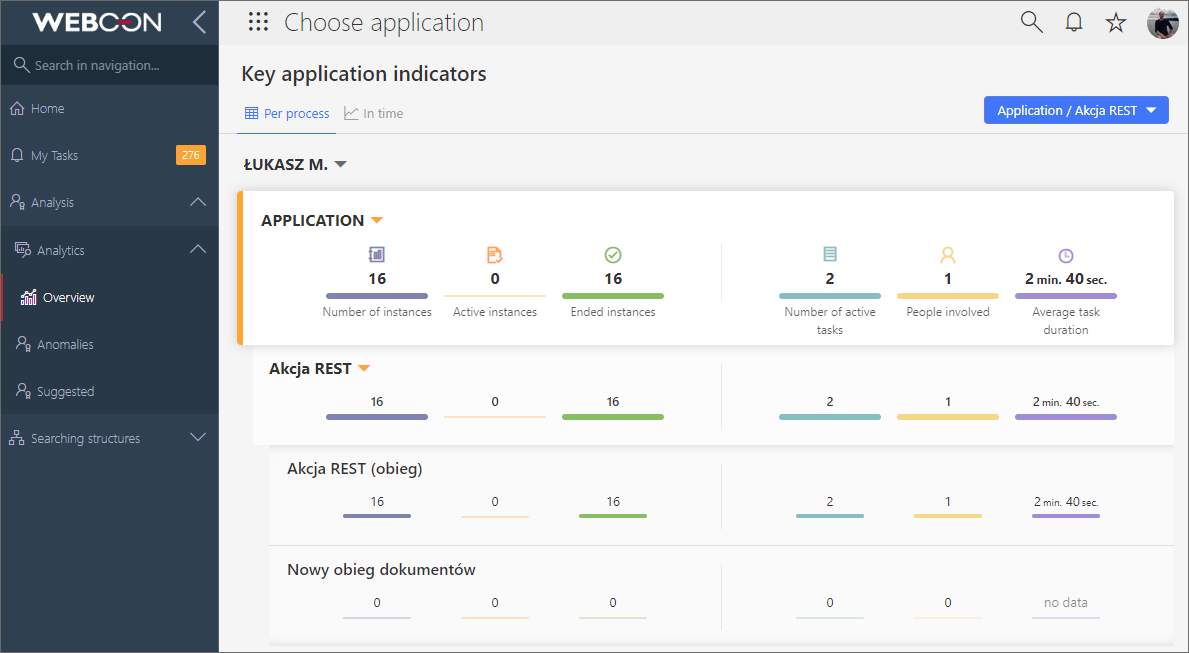
The Analytics node
Apart from the above-mentioned analysis functionality that is available in Designer Studio, Portal users can use a dedicated Analytics node (under the Analysis master node) available in the left-side menu. The node provides the most important numerical data and time ranges in the context of available applications. What is more, the functionality allows users to track trends related to the system operation and display a Heatmap for a selected application.
To learn more about data analysis in Portal, read the ARTICLE available on the WEBCON Community website.