Line chart
On a line chart, category data (label column) is spaced out evenly on the horizontal axis while the series values (data series) are spaced out over the vertical axis.
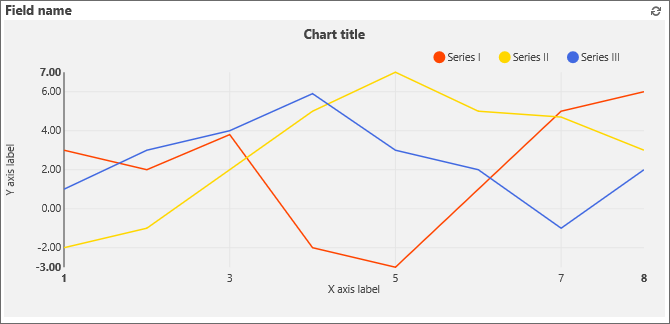
The location of the title and axis labels in the Line chart is shown on the screenshot above. The legend is located in the top-right corner with legend entries for each series.
By default, all data series selected in the chart’s Advanced configuration are visible. They can be hidden/shown by clicking the legend’s icons:
- a single click hides the selected series,
- double-clicking on a series hides every other series except the selected one,
- if only one series is left visible, clicking it once quickly returns to the default view (all series visible).