Analytics
This feature allows you to view statistical information about an application or process.
WEBCON BPS Portal has a separate Analytics section with tabs that compile crucial metrics for available applications. Additionally, ypu can track Trends on working with the system and visualize workflows as a Heatmap.
This feature requires an active WEBCON Advanced Analytics Framework license.
All Analytics reports, overviews, and indexes are prepared on the basis of information processing enabled by the OLAP role of WEBCON BPS Workflow Service.
Key application indicators
The section can be accessed by selecting Analysis → Analytics → Overview.
It is divided into two tabs: Per process and In time.
By default, the global business administrator have access to data of all processes and applications in the report. Similarly, a process business administrator can only view data from processes they have access to.
Users with global privileges for Workflow data read-only access can also view WEBCON BPS analytical indicators.
Per process
The tab's content may vary depending on the applications used and the privileges granted to the user.
The report groups and presents data from individual applications according to their current state, sorted in alphabetical order, mirroring these in WEBCON BPS Designer Studio. Clicking on an application's name expands a list of its processes, and clicking on a process displays a list of related workflows.
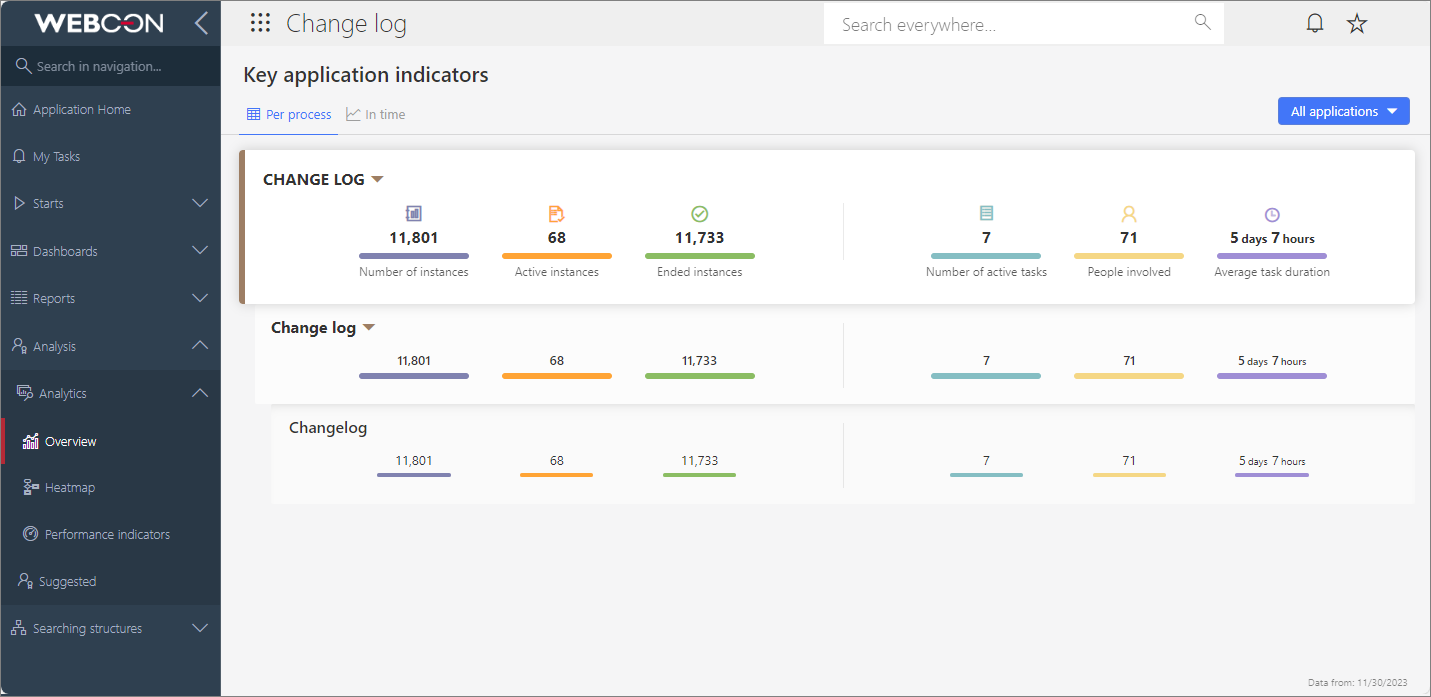
Number of instances
Number of all instances created so far in the application processes.
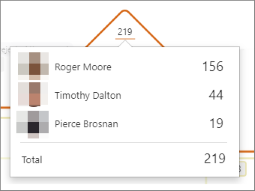
Use the Filter to see how many instances created in a specific process or workflow are currently in a given step.
The bar represents the percentage share of a given value in the highest value at that grouping level.
Active instances
Number of instances that are currently in steps other than the final step.
Use the Filter to see how many active instances of a specific process or workflow are currently in a given step.
The bar represents the percentage share of a given value in the highest value at that grouping level.
Ended instances
Number of all instances that are currently in the final step.
Use the Filter to see how many instances have ended in a specific process or workflow.
The bar represents the percentage share of a given value in the highest value at that grouping level.
Number of active tasks
Number of currently active tasks of all users. Tasks assigned to user groups are presented as a single task, regardless of the number of users in the group.
Use the Filter to see the number of active tasks in a specific process, workflow or step.
The bar represents the percentage share of a given value in the highest value at that grouping level.
People involved
Number of users who registered a workflow instance or personally completed at least one task assigned to them. Users with canceled tasks are not included.
The bar represents the percentage share of a given value in the highest value at that grouping level.
Average task duration
The average time elapsed between the creation of a task and its execution by a user. Indicator calculated for tasks of all users. Canceled tasks are not included.
The bar represents the percentage share of a given value in the highest value at that grouping level.
If any parameter lacks data, it will be grayed out, and the information "no data" will be displayed for it.
Filter
The filter enables you to narrow the report view to the data of a selected application, process, workflow, or even a step.
The above indicators are also accessible through the chosen application. This will automatically narrow the filtering to the particular application, and the indicators will be based solely on related statistical data.
In time
By selecting this tab, you can view figures depicting workflow instance performance over self-defined time periods. This report provides a visual representation of information sorted chronologically. It includes details on the numerical status of individual instances, operations, and tasks, along with the time allotted for their processing and execution.
If a filter is applied in the Per process section to narrow the displayed information, such as in a chosen workflow, the filtering settings will automatically carry over to this tab (and vice versa).
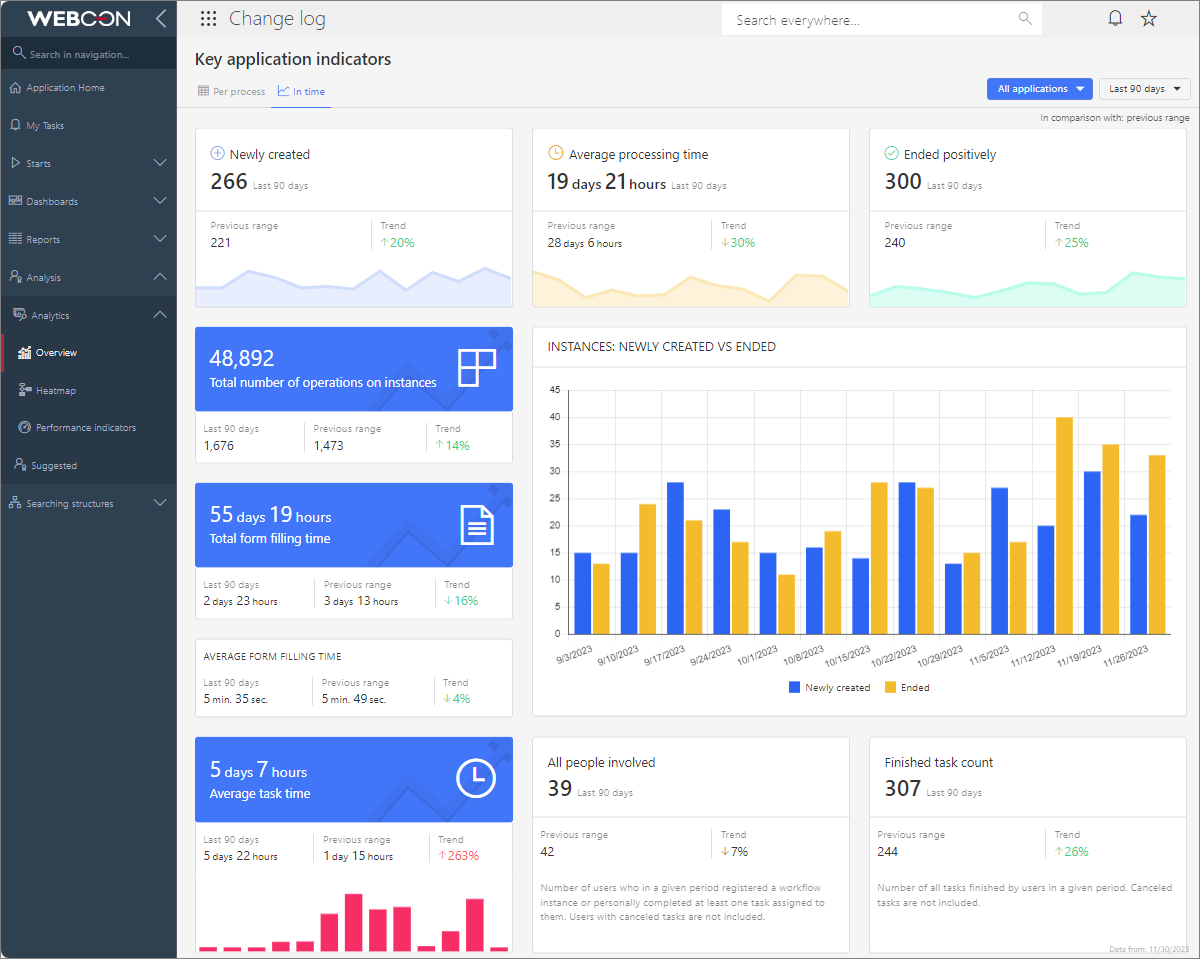
Newly created
Number of instances created in a given period.
Average processing time
The average processing time of an instance from the time it was created until it entered the final step, expressed in calendar days.
Only instances created in the positive final step are analyzed.
Ended positively
Number of instances that entered the final step in a given period.
Only instances currently in the positive final step are analyzed.
Total number of operations on instances
Number of all operations, such as instance saving or going through the path, performed on instances manually by users or automatically by the system.
Instances: Newly created vs Ended
The chart shows the total number of all instances created in the selected time period against the number of all instances ended in that period.
An instance in a positive or negative final step is considered ended.
When aggregating the data, the time of instance creation is taken into account, and in the case of ended instances – the time of entering the final step.
Total form filling time
The total time users spend editing an instance.
Editing time is counted from the moment users start editing an instance by making changes on the form to the moment of saving or going through the path.
Average form filling time
The average time users spend on a single edit of an instance.
Editing time is counted from the moment users start editing an instance by making changes on the form to the moment of saving or going through the path.
Average task time
The average time elapsed between the creation of a task and its execution by a user. Indicator calculated for tasks of all users. Canceled tasks are not included.
All people involved
Number of users who in a given period registered a workflow instance or personally completed at least one task assigned to them. Users with canceled tasks are not included.
Finished task count
Number of all tasks finished by users in a given period. Canceled tasks are not included.
Filter
The filter enables you to narrow the report view to the data of a selected application, process, workflow, or even a step.
The above indicators are also accessible through the chosen application. This will automatically narrow the filtering to the particular application, and the indicators will be based solely on related statistical data.
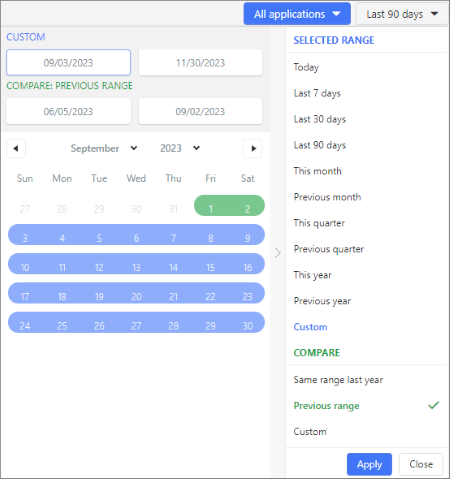
Time filter
By default, the system displays data from the past 90 days. Choose the period for displaying statistical data or select from the preset options available for daily, monthly, quarterly, or yearly periods.
Furthermore, you have the option to compare data from the equivalent Previous range (like year-on-year) to obtain relevant Trends on all noted parameters, i.e. task completion, time involved, form usage, and more.
After selecting the desired time range on the filter, the information displayed on all sections of the tab will adjust accordingly.
Workflow heatmap
The report allows you to analyze statistical data for a particular application (after opening it and navigating to a specific node in the menu). It takes the shape of a workflow diagram that highlights the "hot" and "cold" points. The steps and paths are highlighted based on their frequency of selection by form users and the time spent on tasks, as displayed in the legend below the workflow. The steps and paths of the displayed workflow are distributed according to the configuration set in WEBCON BPS Designer Studio, which can be altered but changes will not be saved.
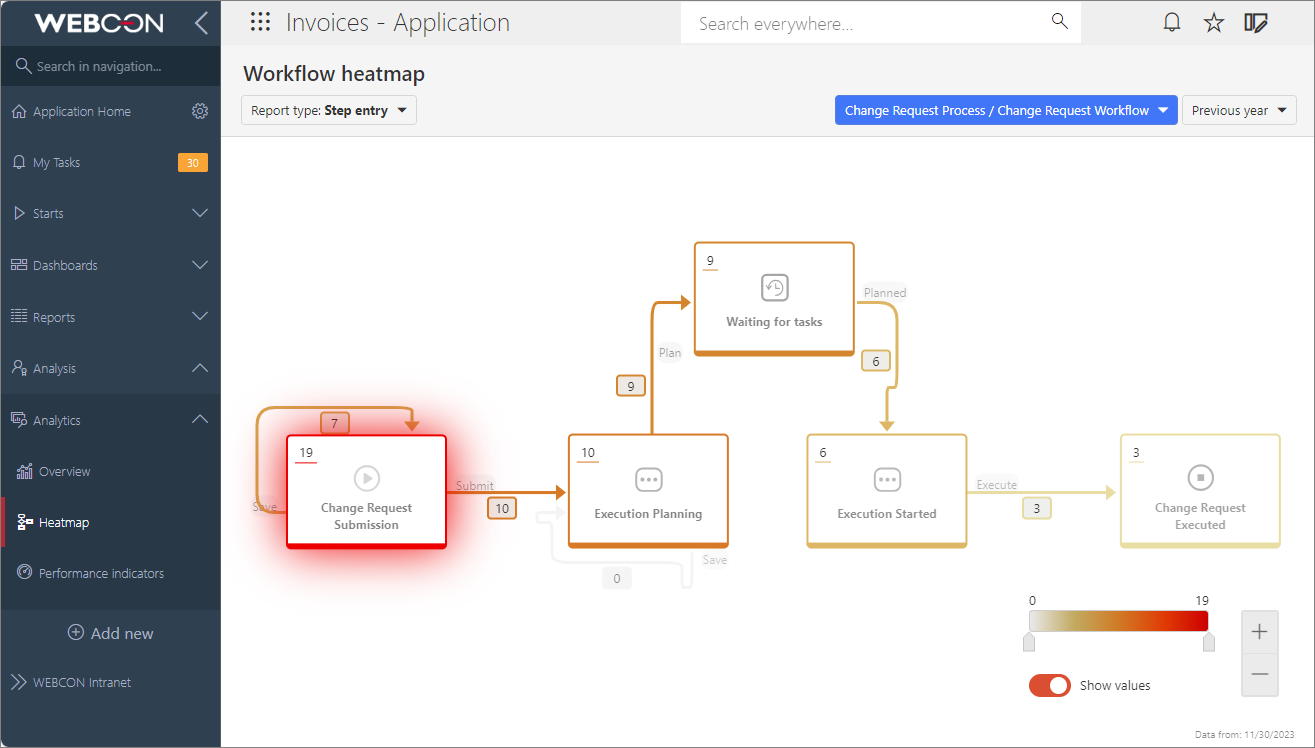
You can choose from the following report types:
- Step entry – total number of entries to the step, workflow, and the number of times users have gone through the path,
- Step re-entry – number showing how often instances returned to the same step,
- Time spent in step (total/average) – time representing how long instances stayed in a given step,
- Task waiting time – average waiting time for task completion by the user to whom the task was assigned,
- Form filling time (total/average) – time users spent on filling out a form,
- Overdue tasks – number of tasks completed by users in a longer time than assumed (specified in the step configuration).
Depending on the selected report type, either an integer or a timestamp (rounded to the nearest 1 hour, minute, or second) value is displayed in the upper left corner of the step and next to the path.
If a workflow instance has gone through a return path that no longer exists on the diagram (e.g. it has been deleted or moved to another step), then this path is drawn in the Step entry and Step re-entry reports as a copy of any path leaving the return step – offset from the original and pointing in the opposite direction. Such a return path is drawn if the workflow instance has passed through it at least once. The number of transitions through the return path is indicated by the counter next to it.
In addition, all return paths are marked with a special graphical identifier (arrow symbol). The return path counter for a particular step is also marked with this icon, and hovering the cursor over it will display the corresponding tooltip.
The Workflow heatmap report can be filtered by:
- users who have had tasks assigned to them in a process – this filter is only available for the reports Task waiting time, Form filling time, and Overdue tasks,
- workflow – the first workflow of the first application process is displayed by default,
- period.
If required by country-specific legal restrictions, filtering by users can be disabled by setting the TopUsersEnabled global parameter to "0" in the configuration database (the default value is “1”).
By adjusting the slider on the legend (scale), you can change the range of values displayed on workflow steps and paths. Additionally, by appropriately configuring the Show values button, the workflow can be displayed to accommodate individual preferences – with or without numeric data.
For more information and examples of use of data analysis in WEBCON BPS, see THE ARTICLE on our technical blog.
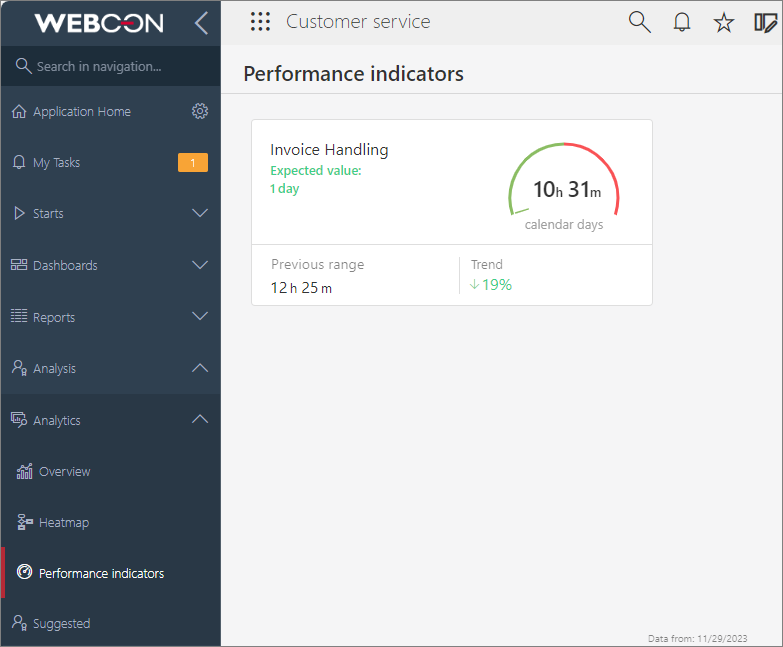
Performance indicators
Performance indicators are used for timekeeping various tasks in the workflow.
The time is calculated based on actions that start and stop the calculation of an indicator. This allows the indicator to encompass any number of steps.
Individual indicators are created in the process configuration.
The primary indicator parameter is the Operating mode, which specifies how time will be tallied: Calculate based on calendar days, Calculate based on working days, or Calculate based on rule.
For Calculate based on working days, it is possible to establish what working hours will count towards the indicator. The working days are configured using the Working days calendar in the System settings.
For Calculate based on rule, the value returned by the rule will be the final value of the indicator. The rule editor contains several additional variables to aid this calculation.
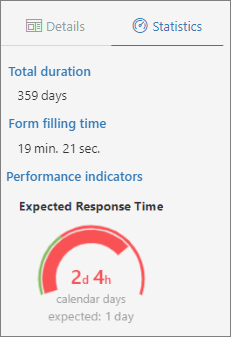
In Portal, Performance indicators are accessible under the Statistics tab of the Info panel and can be configured as a Dashboard widget or Report column. In the Instance history, the indicators are displayed as linked points, which include the steps in which they were counted.
Performance indicators in the form of Dashboard widgets can be displayed for users with at least the following privileges:
- Access and edit all workflow instances,
- Access all workflow instances and attachments,
- Access all workflow instances (excluding attachments).
The dial represents the elapsed time as a proportion of the calculated time to the expected time configured for the indicator.
For more information on Performance indicators, see THE ARTICLE on our technical blog.