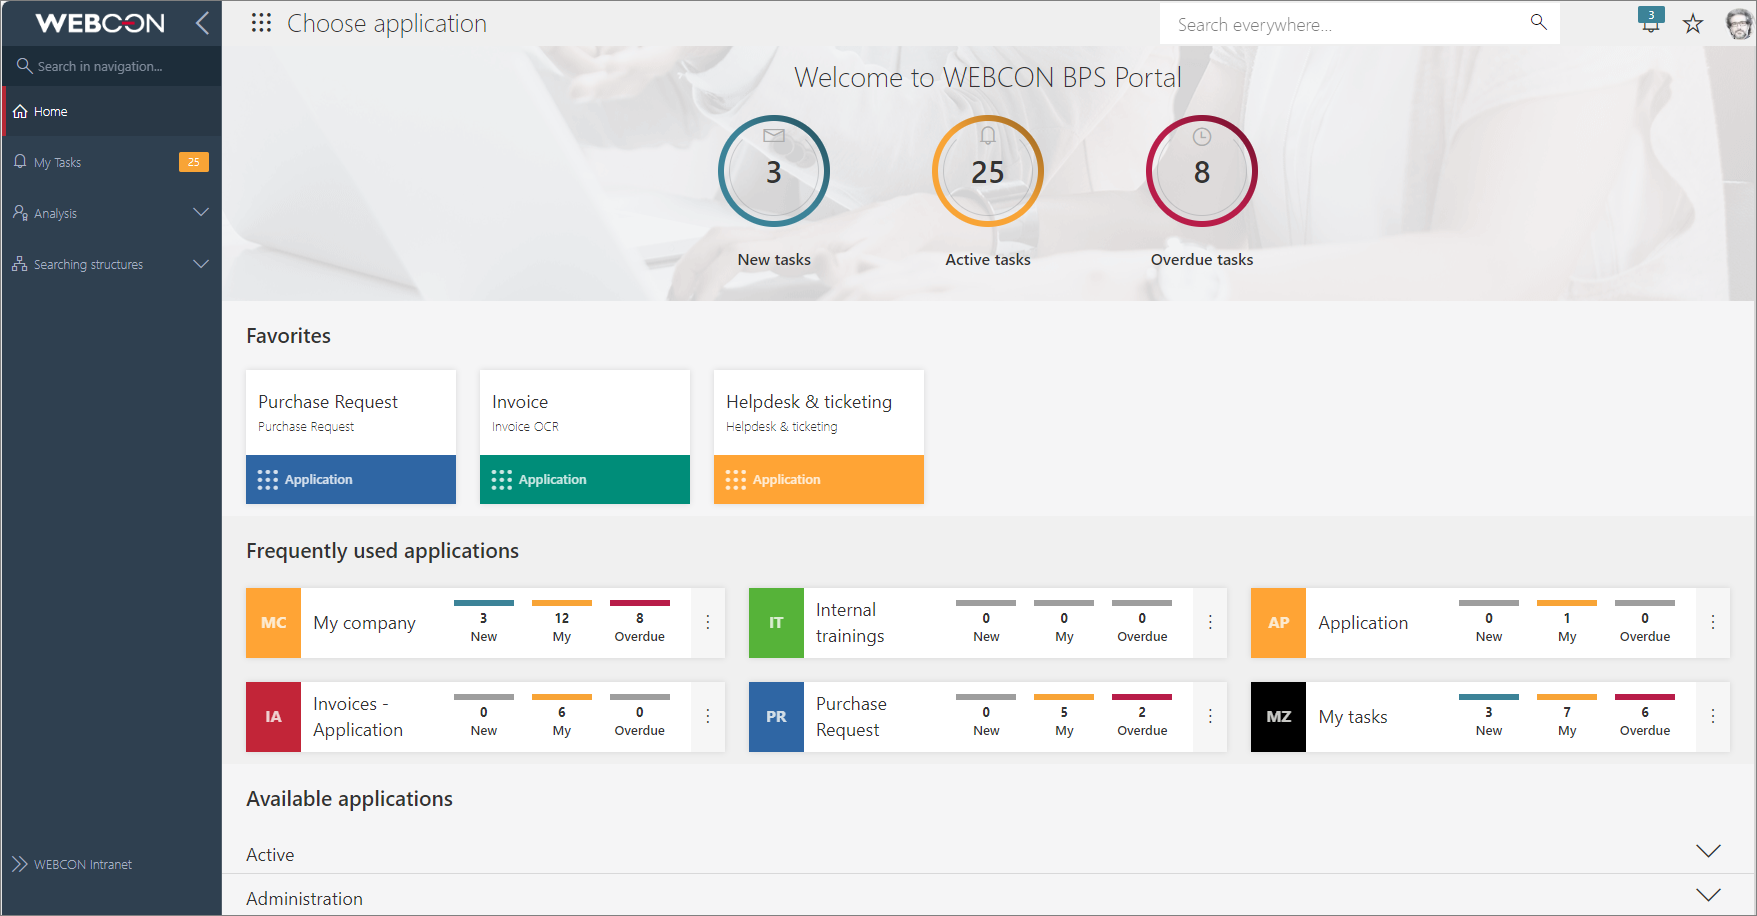
Portal
WEBCON BPS Portal is the primary display medium for the WEBCON BPS system. It serves as a multilingual user interface where users can participate in the applications that we build for them. Within such Applications, users contribute to business processes by completing tasks on forms and advancing workflows. They also have access to a multitude of presentation elements – tables, charts, and dashboards – which aggregate and display useful data to them. Staples of modern business process management software, such as working with attachments, automated events (triggered or cyclical), and access to historical data on workflow instances, are also available here.
To streamline user privileges, access restrictions, and for ease of data compartmentalization, the entirety of Portal is divided into applications which serve as sub-sites. These in turn are built from business processes, which can be grouped thematically into appropriate Applications, exist solo, or be related to other Applications.
Portal can be accessed through a web browser, a mobile application, or dedicated MS Office add-ins, allowing users to work on their projects using familiar and proven tools at any time. Segments of Portal can also be embedded on external sites, and on SharePoint via Web Parts.
Tasks and integration
Users participate in business processes by completing tasks and working on Forms configured in the production environment in WEBCON BPS Designer Studio, which is directly integrated with Portal. Completion of a task allows the workflow instance to progress to the next step, which can be yet another task for a different (or the same) user, involve some automated event, or finish the workflow.
Information entered by users in Portal is stored in a shared database and can be used globally to further configure applications. Tasks in WEBCON BPS Portal can be executed manually by users or automatically by the service, depending on their type.
Presentation of data
The data that is collected in Portal can be displayed via Reports, which compile the most important information in a given context. Reports are particularly helpful when dealing with large amounts of data, as they allow for grouping, filtering (e.g., by time criteria, priority, or people responsible for task execution), and displaying information as both tables and charts.
Dashboards serve as digital desktops that can show multiple reports and various interesting widgets. These can be targeted towards a specific audience and purpose, from a “Start here” page to onboard new users, to dense compilations of data from many sources.
Personalization
Users are free to customize their Portal interface to reflect their personal preferences. In addition to color theme and language, they may pin their favorite and most used applications, presentation elements, or even instances for quick access. More advanced users may also customize their own report views, adjusting the arrangement of columns and applying filters and grouping to help them with their day-to-day tasks.
Analytics
Thanks to the available analytical indicators, Portal provides valuable information about the life cycle of workflow instances, the use of individual applications, and the time spent working with the system. The statistical information collected in this way can then be compared with data from similar past periods to track trends in user activity and system usage for assigned tasks.
Diagnostics
Users can perform diagnostic activities in Portal, which helps to identify process bottlenecks and potential system issues. The event logs generated by the system are an important source of information for administrators and specialists responsible for system management.
Administration
Administrators can access a dedicated panel to control and configure selected system settings. From here, they can define and manage BPS users and groups, create API access keys, or view diagnostic sessions logged by system users.