Dashboards
Dashboards are virtual desktops that present data from within the application, help with navigation, and provide users with convenient access to relevant areas and information.
Default application dashboard
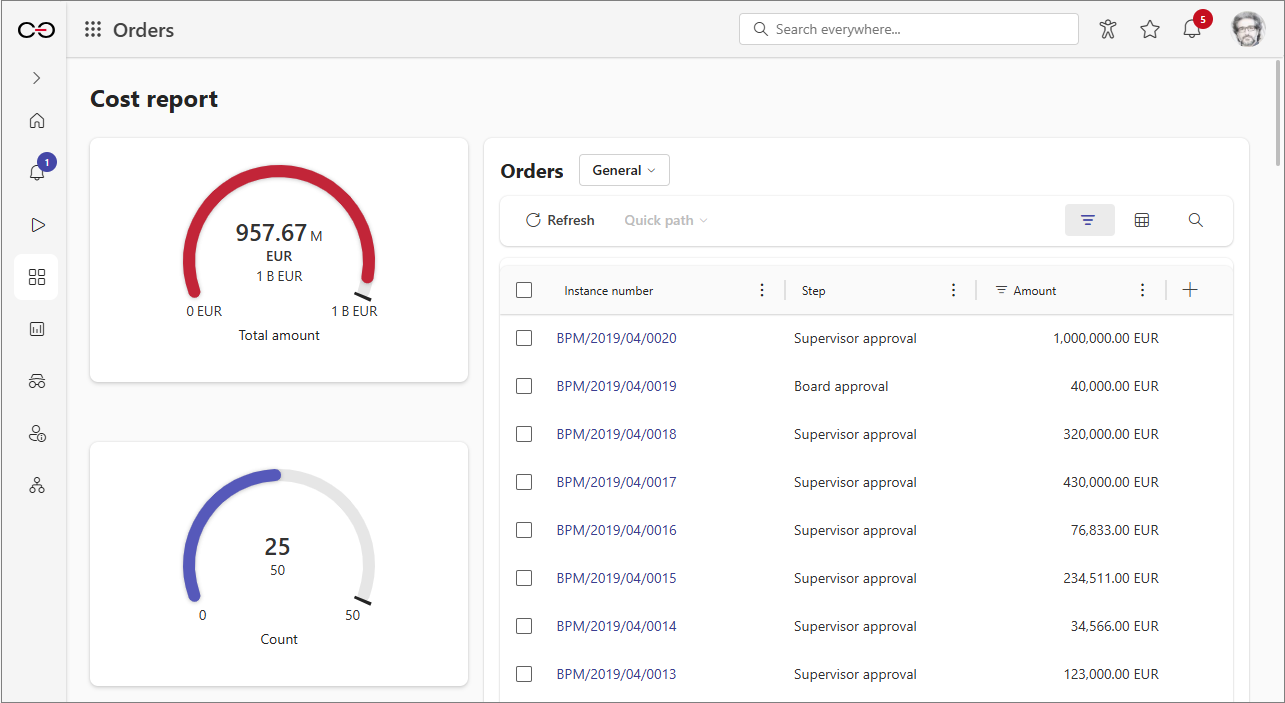
The so-called default application dashboard is created automatically upon application creation. It includes standard elements such as the Task counter widget, buttons for registering new instances, and the Suggested dashboards and reports and Recent activities sections.
The default application dashboard also serves as the application's main page. While it cannot be deleted, its content can be freely modified.
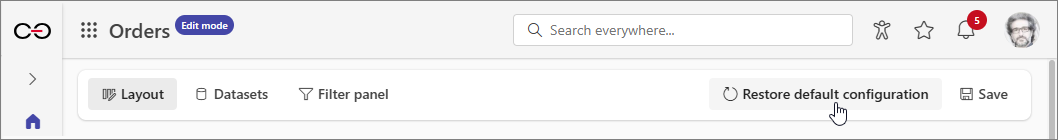
You can restore the default appearance of this dashboard at any time using the Restore default configuration button, which is available in the dashboard toolbar after enabling the application edit mode.
Application dashboards
Users can define additional dashboards for any application and customize their content to meet specific requirements. Dashboards can contain various elements (widgets), such as reports, Start tiles, performance indicators, and navigation widgets that allow users to access other dashboards or application reports.
Configuration
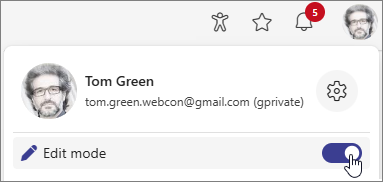
Only users with the appropriate privileges (Application administrator or Business administrator) can create and configure dashboards. Configuration access applies to all dashboards within the application. To create a new dashboard or edit an existing one, you must first enter the application's edit mode. To do this, navigate to the target application, open the User menu, and click the Edit mode button.
Dashboard configuration is generally possible only in Portal, but please note that Designer Studio also offers some options in this regard. Using the Dashboards node in Designer Studio, users can create new dashboards, as well as name and describe them (Name and Description). Additionally, you can use the Configuration button here to open the dashboard configuration window in Portal.
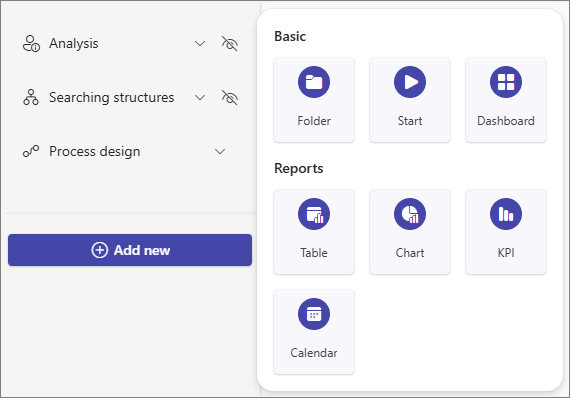
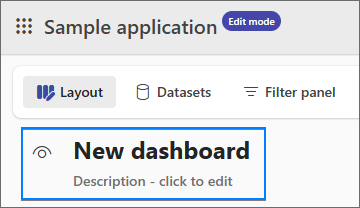
Once you enable Edit mode, click the Add new button in the Navigation menu and select the Dashboard option.
You can change or translate the default name and description of the newly created dashboard in its upper-right corner. You can also hide these elements by clicking the Hide title and description button.
Dashboard design
The design grid used for dashboard configuration is based on the React Grid Layout library and is used to arrange widgets in a flexible way. The grid consists of 12 fixed-width columns and a dynamic number of rows.
Adding widgets to the dashboard
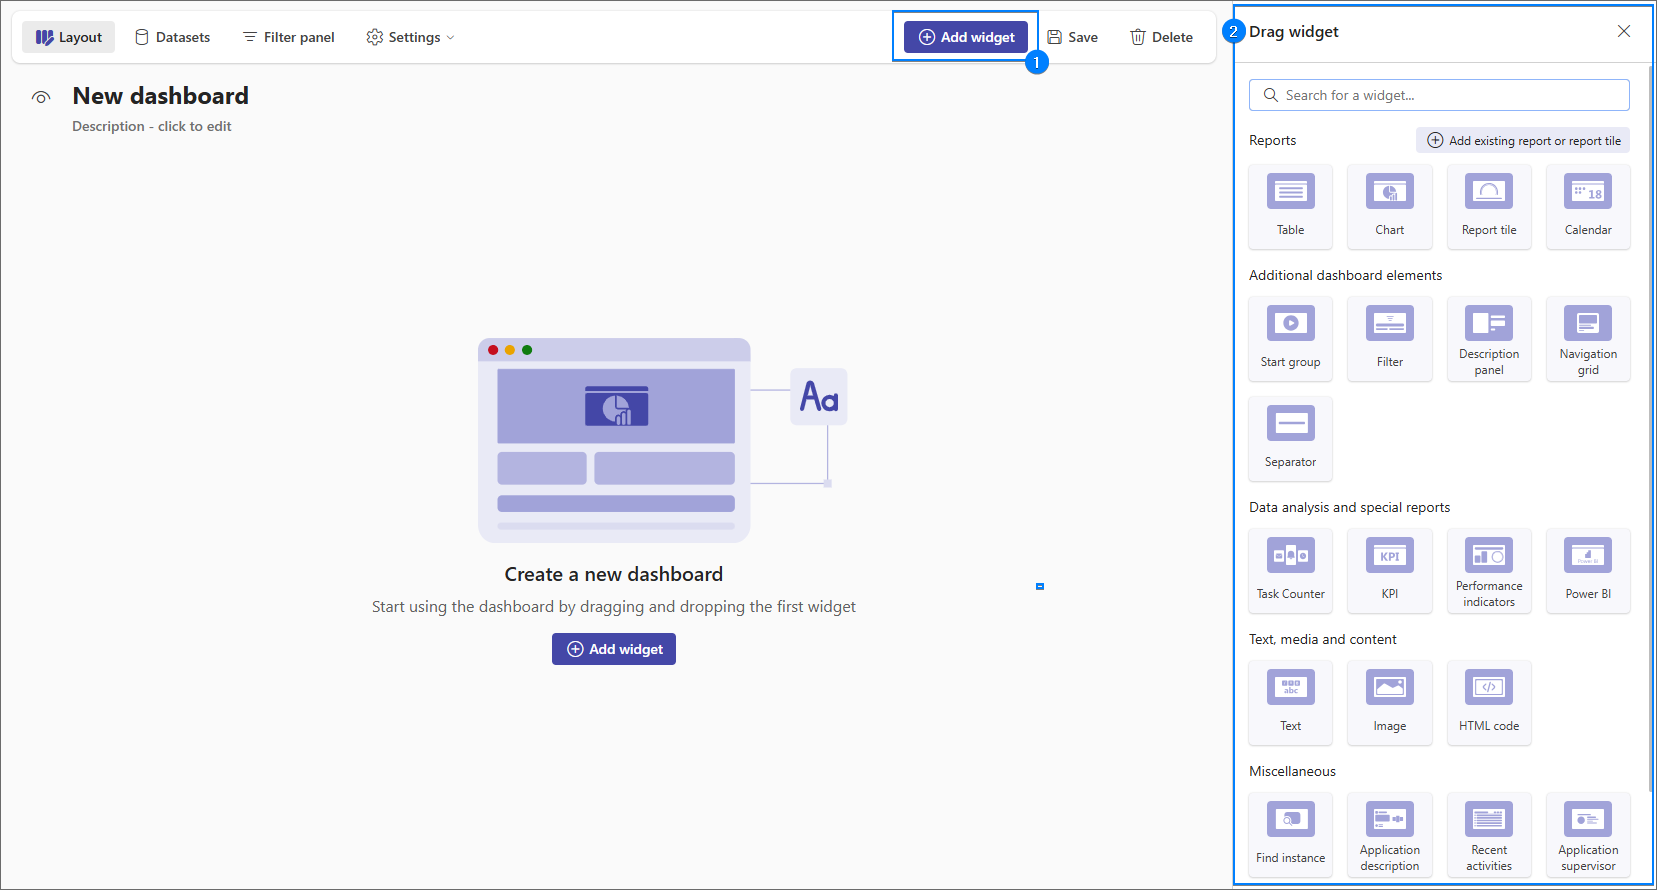
The configuration window of a newly created dashboard does not contain any elements (widgets). To add them, click the Add widget button located on the right side of the dashboard's top panel, which opens the widget selection panel.
Adding and moving widgets is only possible if the dashboard width is at least 1024 px. Otherwise, the user can only edit the configuration of existing widgets.
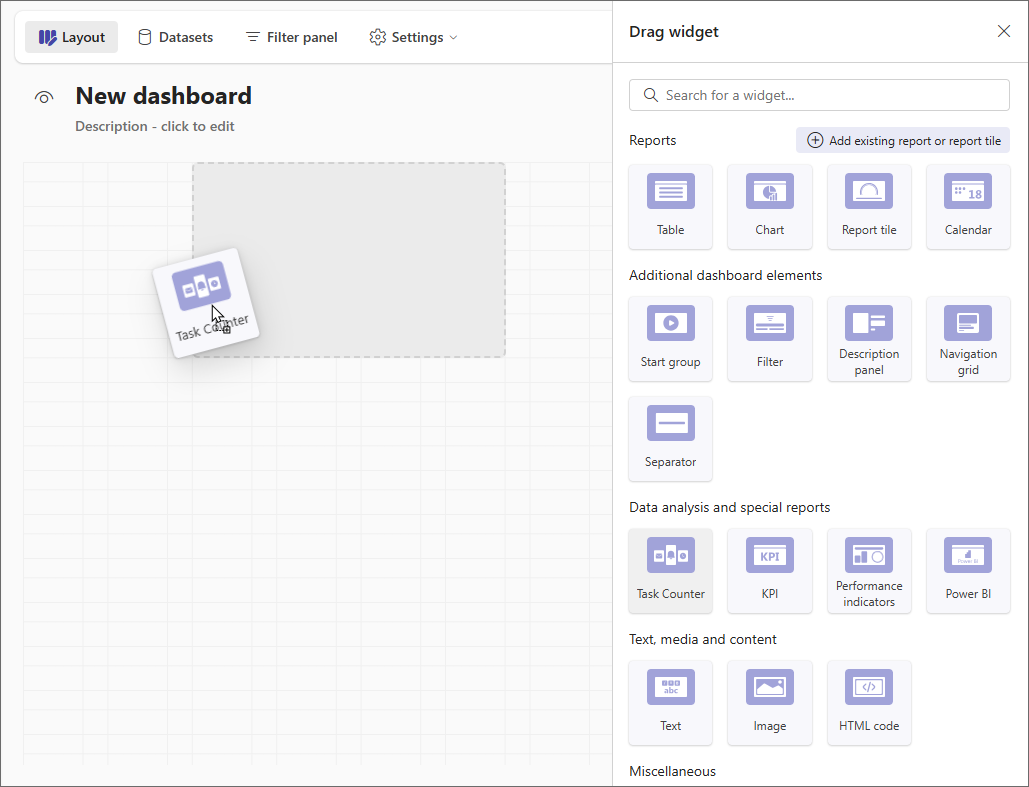
After selecting a suitable widget from the panel, it is inserted by dragging and dropping, and then automatically "snapped" to the top edge of the dashboard to eliminate empty space.
If it is necessary to lock the position of a widget and prevent it from moving upward, you can use the Separator widget.
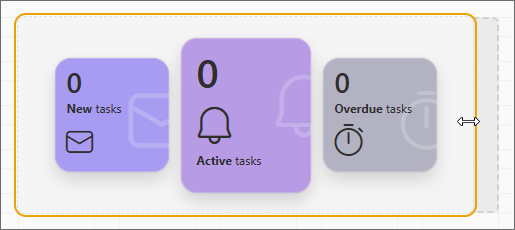
Widgets placed on the grid can be resized horizontally by manually dragging their edge. Additionally, for some widgets — such as Table, Image, HTML code, or Report tile — the height can also be adjusted, provided the Automatic height option has not been enabled for them.
Dashboard data sources
Users can create data sources assigned directly to dashboards and manage them. These data sources can then be reused to populate various reports embedded on the dashboard.
-
Creating a data source for a dashboard
Users can create a data source for a dashboard while creating a report (except for KPI and Vacation Schedule reports which do not utilize data from data sources). After selecting the report type from the Add new element menu, the Select dataset for report or report tile menu appears.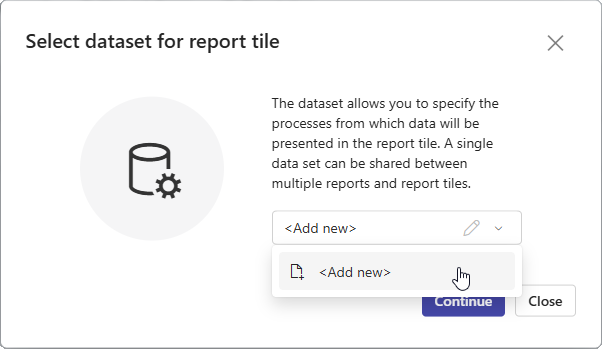
The window allows you to associate the created report with an existing data source (selectable from a drop-down list and configurable by clicking the pencil button) or create a new one by selecting the Add new option from the drop-down list. The type of data source depends here on the selected report type.
infoUnlike data sources created for application reports, the dashboard data source does not allow users to specify the number of rows displayed per one report page. This option is only available in the dashboard report configuration window.
infoIf a visibility rule has been defined for a form field included in the data source configuration, a corresponding message is displayed in the Dataset columns section (under the Columns tab) next to its corresponding column to inform users that this column may not be visible in the report.
-
Managing dashboard data sources
You can manage the data sources created within the dashboard using the Datasets tab in the dashboard configuration window. The configuration of the selected data source is possible in the right section of the window. Both the tabs and options available here correspond with the tabs and options visible when creating the data source.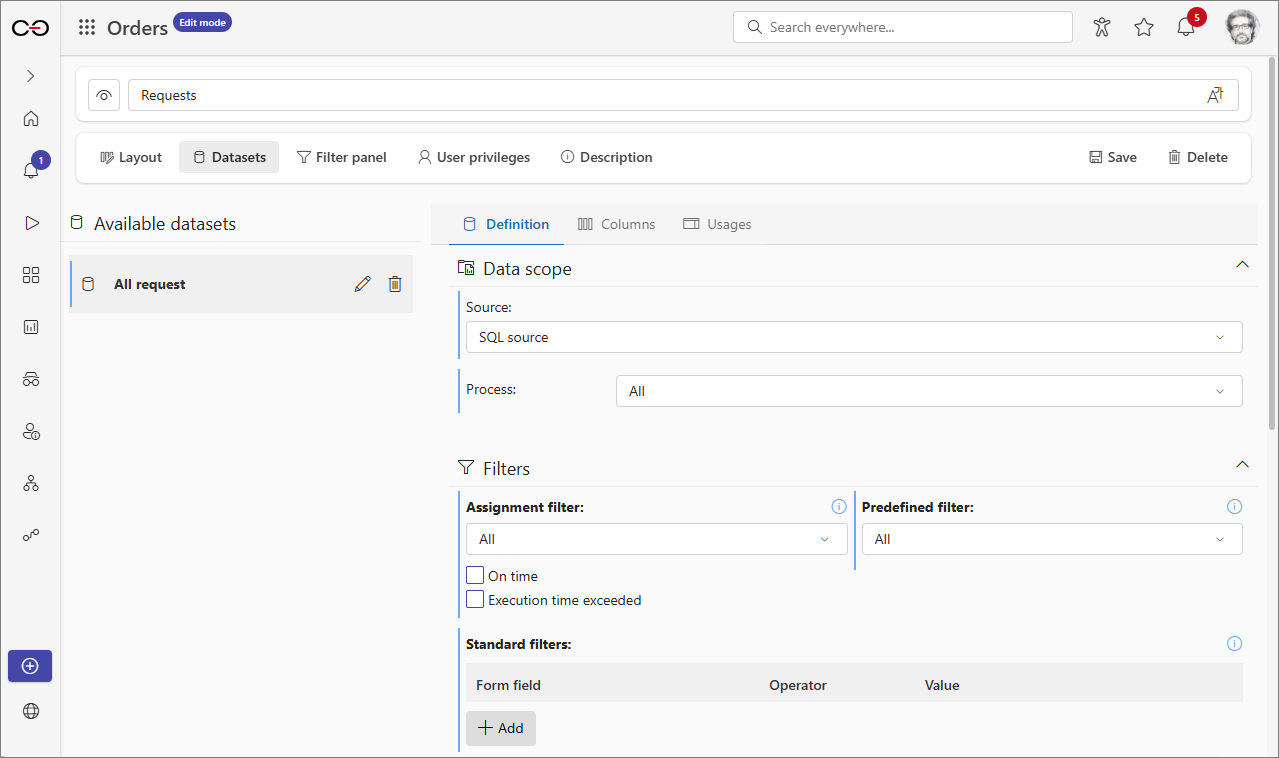
Filter panel
The tab allows users to define filters for the dashboard dataset. These filters can then be applied to the data displayed in reports and Report Tiles which are embedded within the dashboard and use the dataset for which the aforementioned filters were created.
-
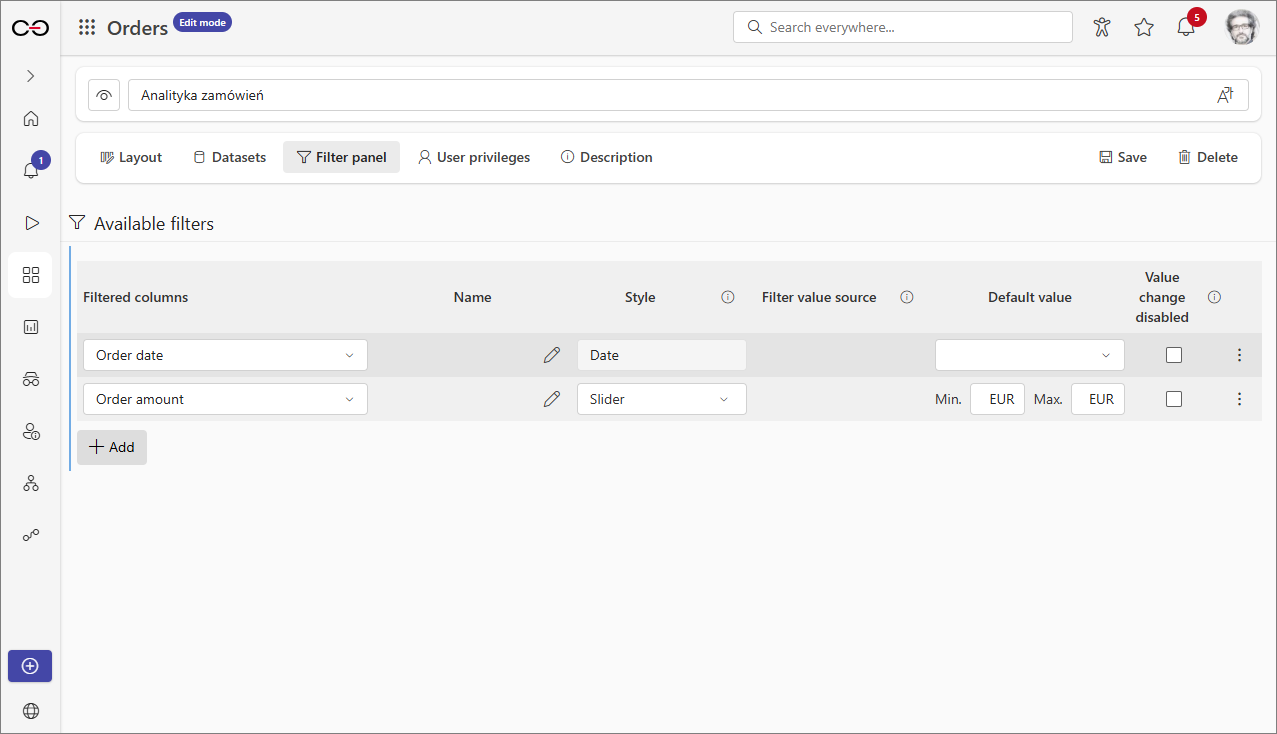
Creating filters for dataset To create a filter, select the dataset column that will be used for filtering. To do this, click the Add button, then select the correct dataset and column under Filtered columns.
infoThe type of the selected dataset column determines the content of the Style, Filter value source, and Default value columns. Therefore, please note that the available options may vary for each filtered column.
After adding a filtered column, you can set a name for the configured filter in the Name column and customize the appearance and behavior of the control in the Style column. Additionally, in the Filter value source column, you can specify whether the available values in a filter come from the report data source or a form field data source.
infoYou can define the filter data source for most Choice fields, except for the Date and time form field.
In addition to the options mentioned above, users can also specify the value with which a filter will be loaded in the Default value column. This value can then be locked by selecting the checkbox in the Value change disabled column. As a result, users of the dashboard will not be able to modify the filter value within the Filter widget.
-
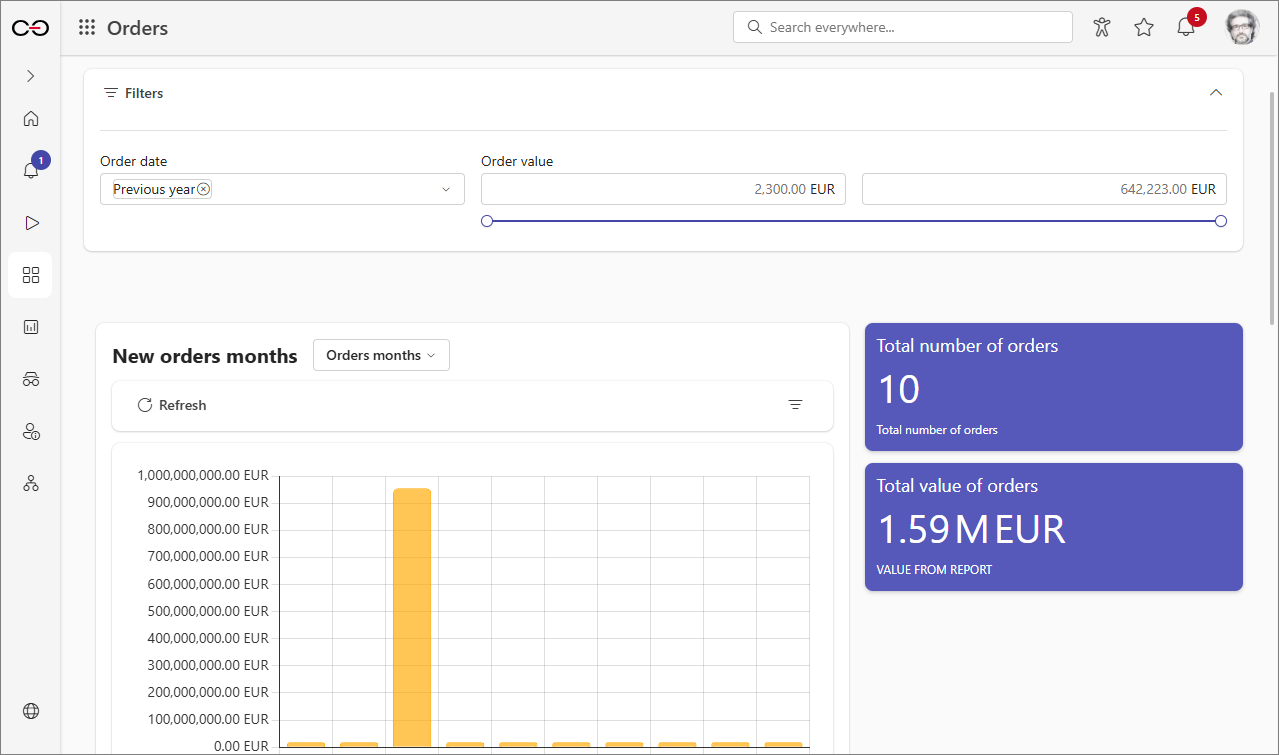
Applying filters with the Filter widget To apply the filters defined in the Filter panel tab, you need to embed the Filter widget in the dashboard. Once you add it, a Configuration panel will appear on the right side of the window. Select the filters to include in the widget and define custom margins if needed.
 info
infoThe appearance of the widget largely depends on the filters embedded within it and the type of filtered columns. Selecting a value within a filter will narrow down the results presented in dashboards and Report Tiles that use the associated dataset.
Privileges to display dashboard
The User privileges tab contained within the dashboard configuration window allows you to specify users or groups who are able to display a given dashboard. By default, the Visibility field for each newly created dashboard is set to Inherited from application. However, users can break the inheritance setting by selecting Custom from the drop-down list. Afterward, clicking the Add button allows you to specify users or groups who are able to display the dashboard.

To learn more about dashboards, read the ARTICLE available on the WEBCON Community page.