Reports
Report is a summary of data from selected workflow instances created in the system. The data presented in the report can be as concise or elaborate as necessary. In its most basic mode, the report takes the form of a table containing workflow instances in the Content database. The visible columns and range of displayed data are fully configurable.
In addition, the report can be a chart, calendar or KPI.
Reports and their Views are created both in Designer Studio and in Portal.
Where to find reports in Portal?
The reports section is available in the navigation menu on the application page.
Expanding the node displays a list of all reports and their views configured in the application.

By default, the reports section contains the All documents group, which has one Basic tabular report.
Adding a new report
Any user with Portal designer privileges can create and modify reports. Reports in Portal are created from the navigation menu or top menu.
Click the Add new button (available when Edit mode is enabled), then select the Report type you want to create in the current application. (The same button is also accessible from the top menu.)

For more information, read the article Reports – configuration, views, editing on our technical blog.
In turn, you can find information on how to configure reports in Designer Studio HERE.
Report types
In WEBCON BPS, you can choose from the following three report types:
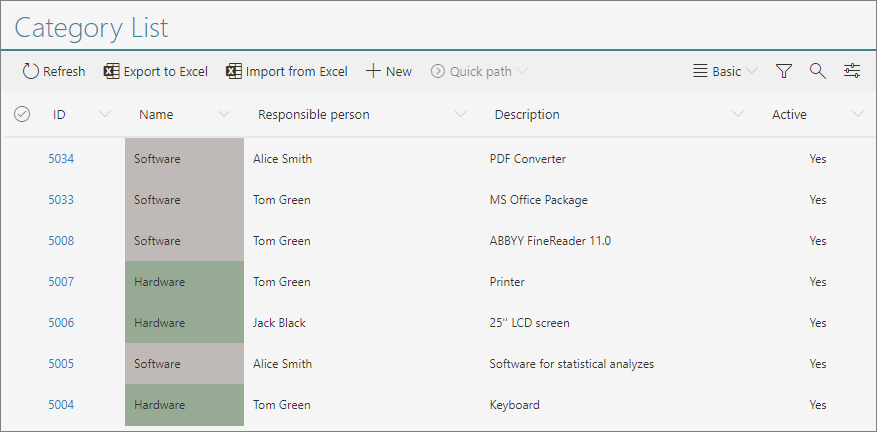
Table
Report in the form of a table that collects information from filled out forms. The table columns are selected system or process form fields, while the workflow instances are its rows.
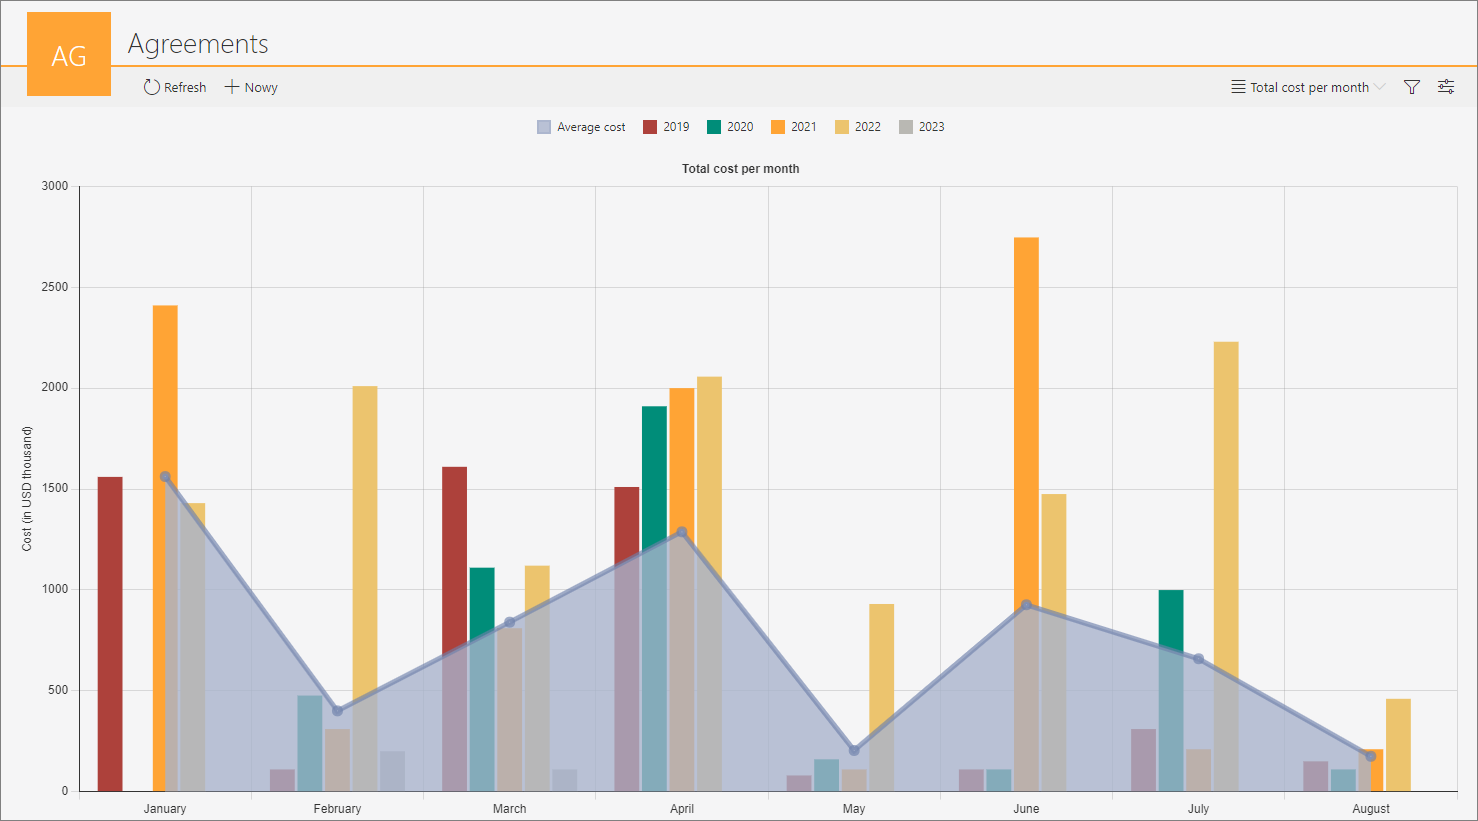
Chart
Report in the form of a chart, where the X axis is the categories defined by the user based on the selected process or system form fields, and the Y axis usually represents the numerical values with which these fields are filled in. (In the case of the Horizontal bar chart, the arrangement of the axes is reversed).
It is possible to configure: Line, (Floating, Horizontal) Bar, Pie, Donut, Stacked (Percentage) charts.
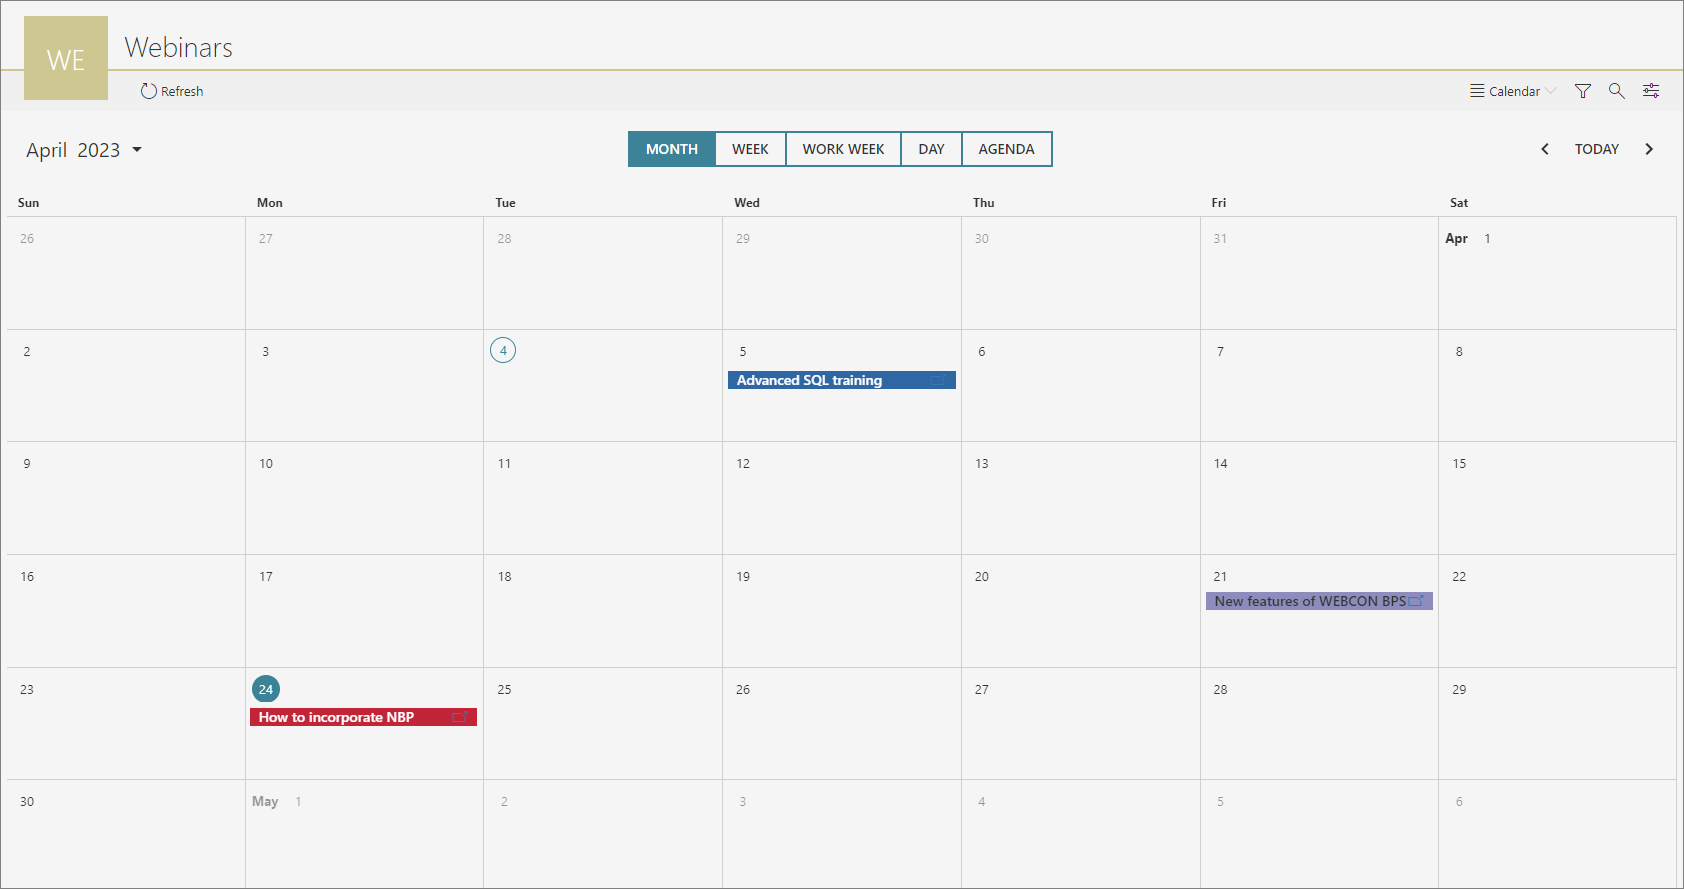
Calendar
Calendar is a report in which workflow instances are displayed in the form of events marked on a calendar. This report can be created if a workflow instance contains at least one Date or time form field.
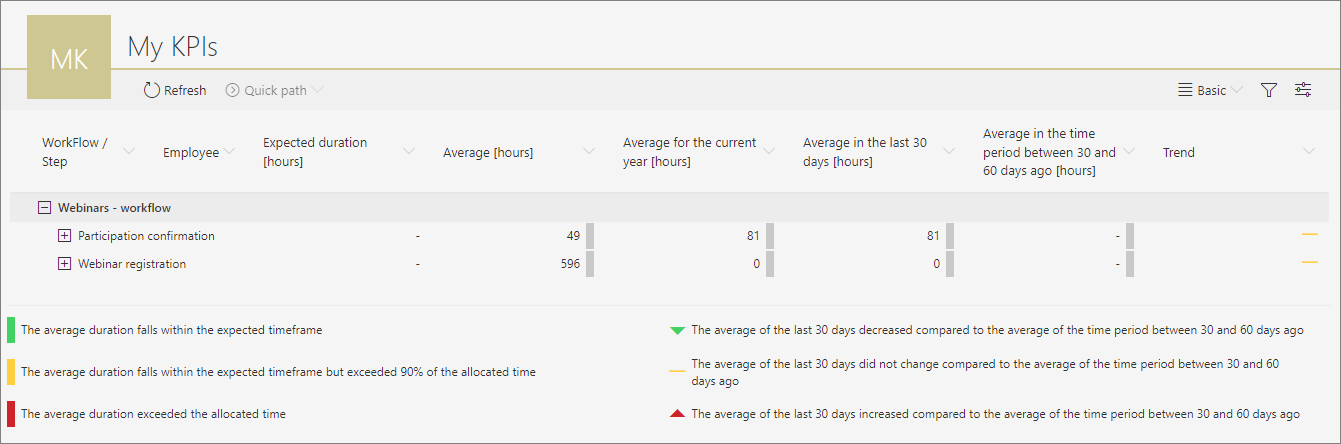
KPI
Report used to graphically present performance indicators defined on each step of the workflow. The report configuration allows you to specify a process and type of indicator (edition statistics or time spent in each step). Data are presented in the form of colorful indicators grouped by workflow, step, or user. The reports are based on statistics that are constantly updated, so they require the appropriate process configuration (the Analysis tab in the step configuration accessible from WEBCON BPS Designer Studio) and the Basic functionalities role for WEBCON BPS Workflow Service to be enabled.
Additional information about KPIs is available in THIS ARTICLE on our technical blog.
Report configuration
Reports in Portal can be customized to summarize key information in a particular context. The report configuration window is available by clicking the ![]() in the upper right corner of the report view. This window is divided into the following tabs:
in the upper right corner of the report view. This window is divided into the following tabs:
Source
This tab is used for defining the range of data presented in the report as well as basic filters to narrow them down.
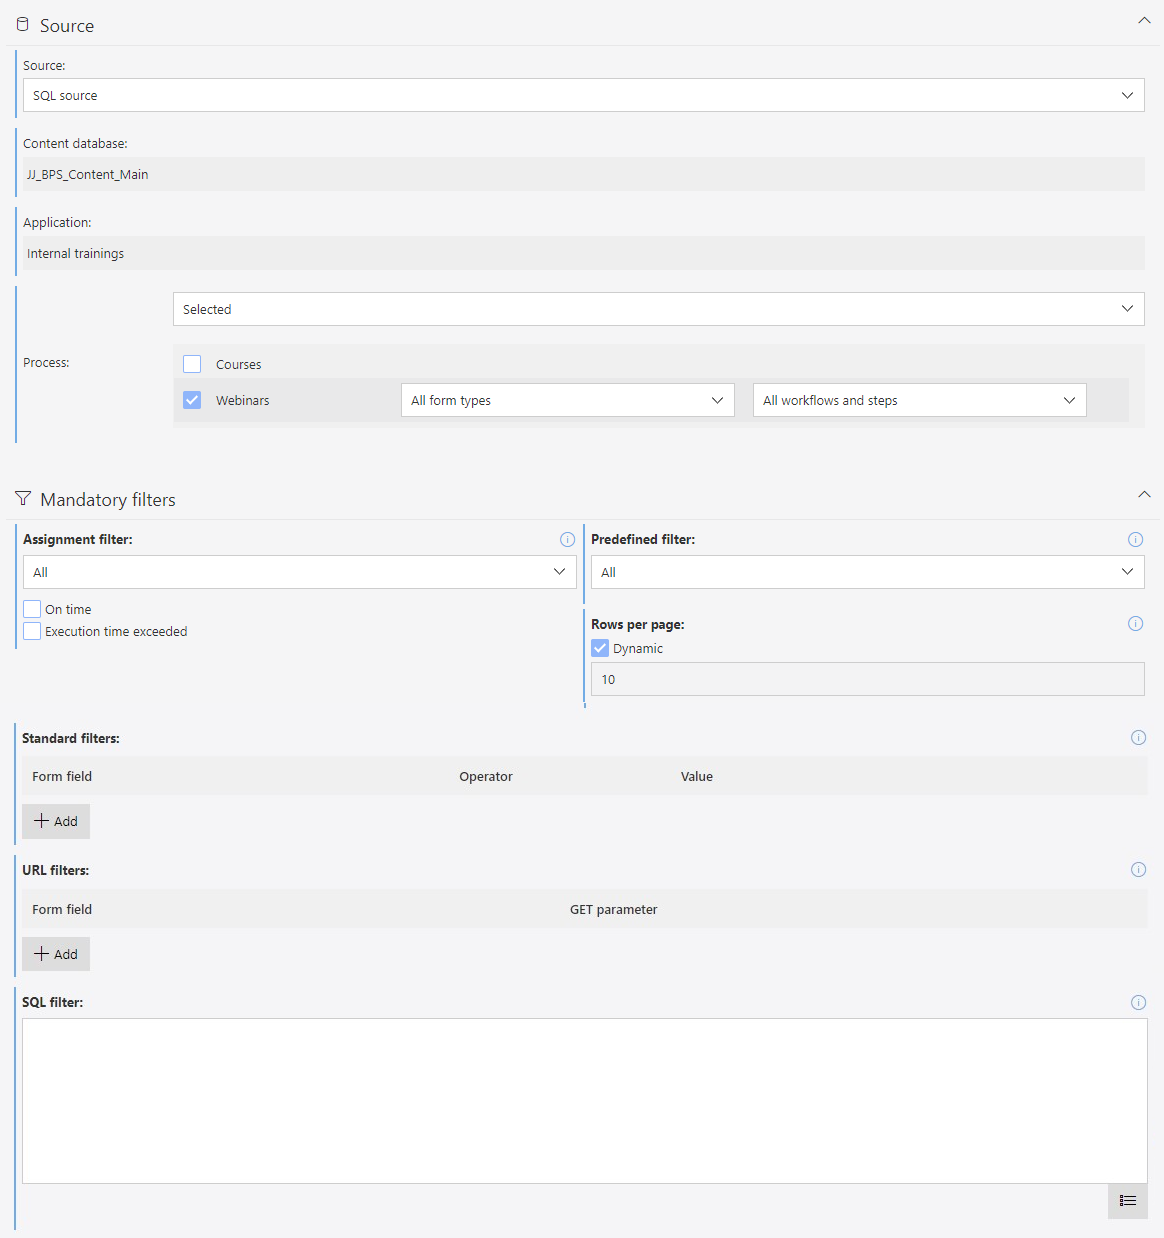
Source
The source is the database currently being used by the system to store workflow instances. Reports can be created based on SQL sources and SearchIndex sources.
For more information see: SearchIndex database as a source in the application reports.
Content database
Default database for storing system content. Use WEBCON BPS installer to create additional content databases.
Application
The current application for which the report is being configured.
Process
The report can present instances from selected processes, forms, workflows, and steps. You can select whether the report will contain instances from all processes, selected processes or will contain only archived instances. The All or Selected options refer to instances from the content database, while the Archived option refers to instances from the archive database.
For more information see Archived instances available in reports and BPS sources.
Mandatory filters
Assignment filter and Predefined filter allow you to narrow down the range of data displayed in the report to your tasks and the selected time period. The Rows per page filter is used to define the number of instances available on one page of the report.
Standard filters
Allows you to make a comparison between the value of a form field and a defined filter, e.g. allowing to display only workflow instances whose "Total value" form field is greater than 1000.
URL filters
Another option to compare the values of form fields. This value should be passed in the URL.
SQL/SOLR filter
Used for filtering data in the report with SQL/SOLR queries.
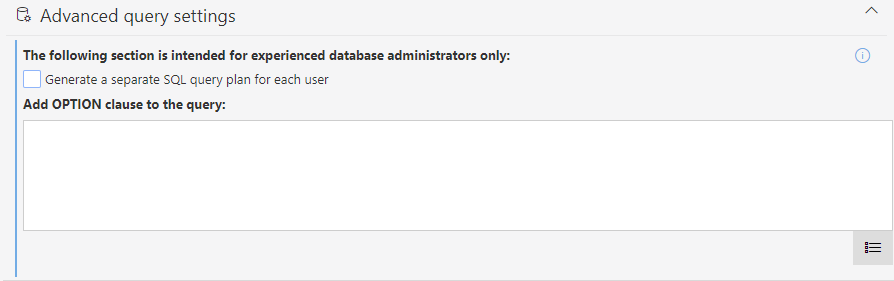
If you select SQL source, the report configuration window will display additional filtering options, as well as the section Advanced query settings at the bottom, intended for users with database management experience. The parameters set in this section affect the execution of the SQL query to the WEBCON BPS database.
Columns available in report
This tab is used to select which data will be available in the report.
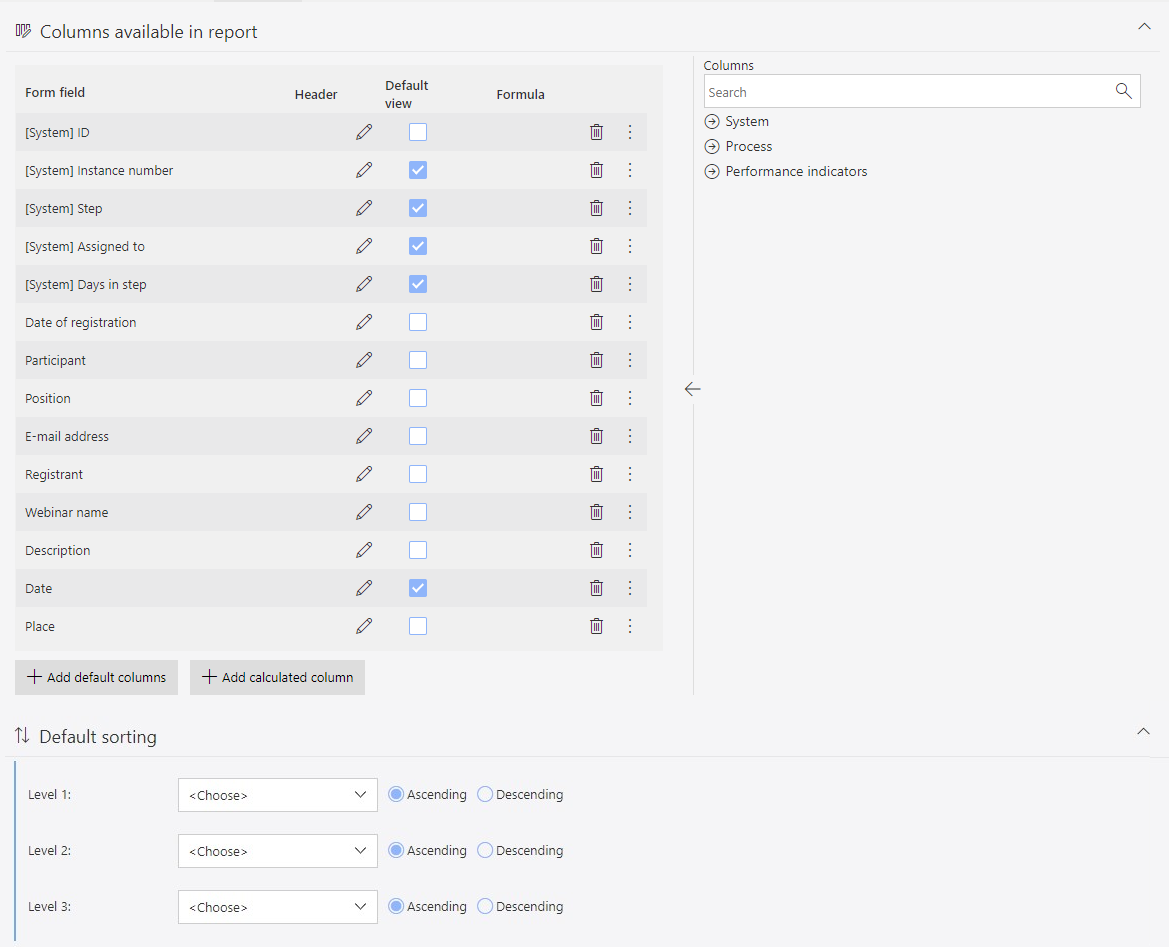
The system will suggest a number of default columns. You can easily add them using the Add default columns button (it is only available if at least one of the suggested columns is not included in the report).
Next to it there is also a button Add calculated column. After pressing it, a window appears in which you can configure a formula for calculating the value of the Text, Variable, Data, Lamp or Link type column.
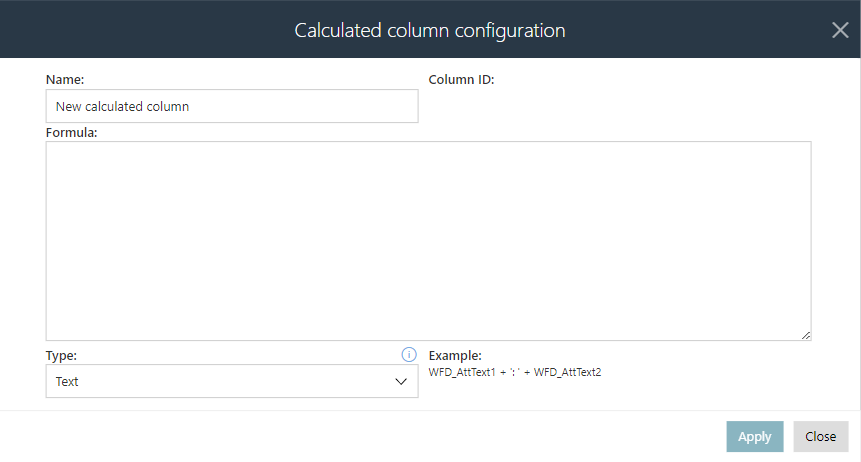
For more information on Calculated columns, see the ARTICLE on our technical blog.
Columns can also be added from the menu on the right-hand side. Double click on a column chosen from the menu to add it to the report.
The column menu is divided into:
- System information – this can be the process for which the instance was created, instance author, the date it was created. System columns are designated by the "[System]" prefix.
- Process form fields – as long as you display workflow instances from a single process, you can add all defined form fields as report columns. This option is unavailable if more than one process is selected as the source of data.
Each column may have a custom Header (with translations into different languages).
You can also set a Default view for each column. Columns marked this way will appear in the report table by default. Other columns will be hidden, but the end user will be able to add them to their report by clicking on the "+" button next to the rightmost column.
Additionally, you can define up to 3 levels of Default sorting by system or process columns. These settings will be visible as soon as the report is loaded.
Search panel
The search panel can be customized so that the columns specified by the user are searched. For this purpose, as in the case of the Columns tab, a menu of process and system columns is available on the right.
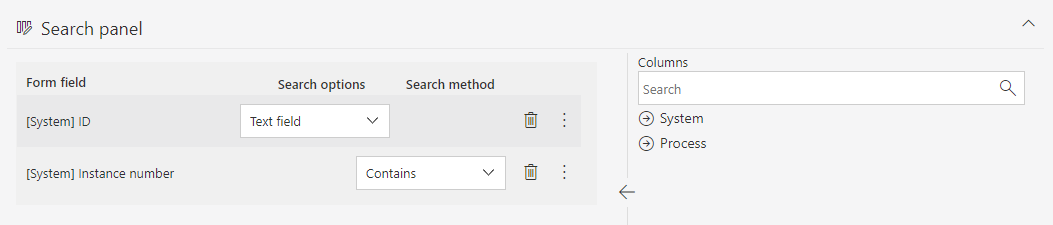
There are two search methods available: the system can search for hits that Start with or Contain the entered phrase.
By default, if no columns are added to the search panel, all columns will be searched (provided that the Search everywhere option is checked in a separate view).
Mass action buttons
In WEBCON BPS, it is possible to create mass acceptance buttons to move multiple workflow instances from the report level.
The functionality allows you to add these buttons on the report and connect a specific Path with them, through which the selected instances will be moved. It is also possible to define a form of mass acceptance allowing the user to input a specific form field value for all accepted instances.
Processing happens in a mass way which means that going through the path is done for all selected instances. After the processing is finished, the user is presented with a report summing up the actions executed for each instance.
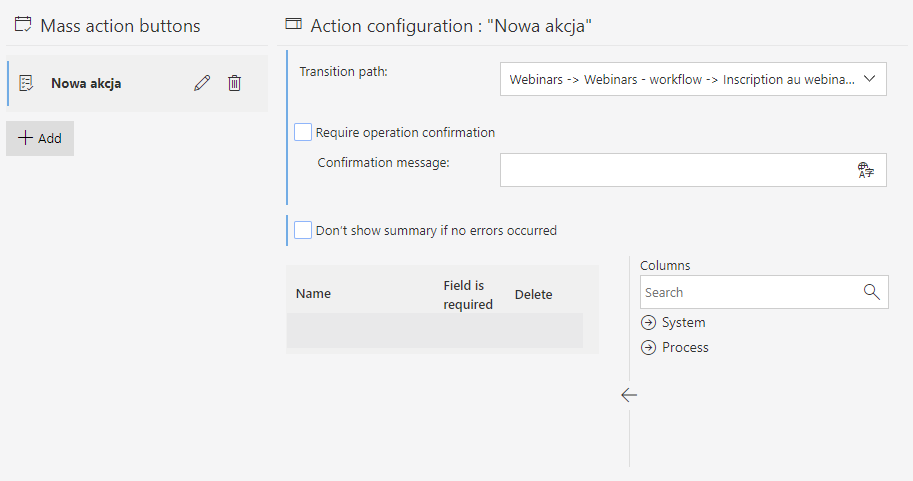
Button configuration involves choosing a path through which the instances will be moved and (optional) defining form fields that will be left to fill in by the user who presses the button. Form fields should be configured by moving them from the Columns section to the left side. You can also choose if filling in a Field is required for the instance to go through the path.
To make a button visible in the report, it must be moved to the Visible buttons column in the Mass action buttons section of the Views tab.
Views
The tab enables customization, filtering and additional graphical highlighting of data returned from selected columns of the defined source. A single report can have any number of views.
A detailed description of Report views and their configuration is available HERE.
User privileges
This tab allows you to create your own private views, define Custom or Inherited from application report visibility for end users, and hide reports in the navigation menu.
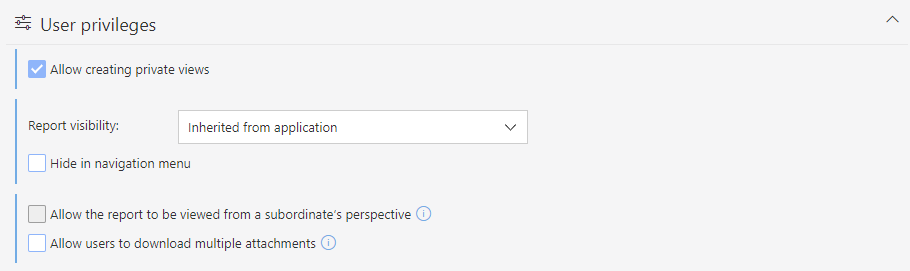
Detailed information on hiding reports in the navigation menu is available HERE.
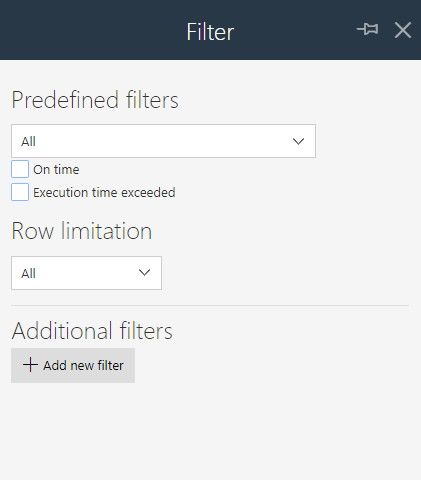
Filters
Items displayed or included in the report can be easily filtered using:
- Predefined filters – by default, the report displays All items, but you can further filter them by selecting one of the available options: Active tasks, All active, All where I participated, All created by me, All active created by me, All where I participated or were created by me.
- Row limitation – by default, the report shows all rows, but you can further limit them by selecting one of the available options: Created today, Created this month, Created this year, Modified today, Last 10, Last 100, Last 1000.
- Additional filters – by clicking the Add new filter button you can specify the range (from/to) or column values by which the report view will be filtered. The columns and the list of their available values will be suggested automatically. Click the Apply button to set the defined filter. Click Restore default or the X next to the specified filter value to remove it.
The above filters are available by clicking on the ![]() funnel icon in the top menu of the report.
funnel icon in the top menu of the report.
Search options
Portal provides the ability to search for individual report elements. This functionality is particularly useful for complex reports with a large number of displayed items and a large amount of data.
You can search reports by typing a specific phrase in the Search everywhere field or by specifying an ID or Instance number.
Search options are available by clicking the magnifying glass icon ![]() in the top menu of the report.
in the top menu of the report.

Search options are not available for the Chart report views.