Dashboards
Dashboards are virtual panels that facilitate navigation within applications and offer their users convenient access to relevant areas and information.
Dashboard types
There are three basic dashboard types. Although similar in visual terms, they are different with regard to their function and the scope of configuration. These are:
-
Portal dashboard
The Portal dashboard is the default site for the given Portal instance. Unlike other dashboard types, you cannot modify its appearance and the elements it contains, which include the Task Counter widget, and the Favorites (visible when a user added a site to favorites), Frequently used applications, and Available applications sections, -
System dashboard
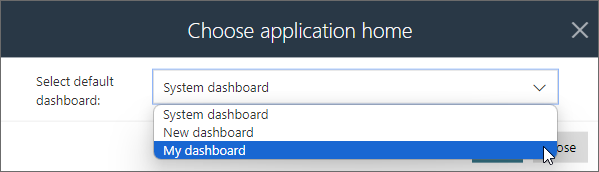
The so-called system dashboard is created together with the application itself. Similarly to the Portal dashboard it contains fixed, standard elements, such as the Task Counter widget, the Start button, and the Frequently used applications and Available applications sections. The configuration of this dashboard type is limited to embedding additional Start buttons. It is by default set as the application main page,infoThe system dashboard is set as the default application page. Although you cannot remove it completely, you can still replace it with an application dashboard. To do so, enable the edit mode, click the gear icon provided next to the Application page button in the navigation menu, and select the relevant dashboard from the drop-down list.
-
Application dashboard
While the Portal dashboard enables users to navigate between different applications available within a given environment, the application dashboard provides access to areas of a specific application, as well as information that is relevant to it. Unlike other types, it is also not created automatically by the system, but by users who hold necessary privileges (Application administrator or System administrator). In this case, it is possible to customize its appearance by placing various elements (widgets) on it, such as reports, Report Tiles, or even performance indicators.
Configuration
Only users with the required privileges (Application administrator or System administrator) can create and configure dashboards. The configurability applies primarily to application dashboards and, to a much lesser extent, to system dashboards (users can add Start buttons).
Dashboard configuration is generally possible only in Portal, but please note that Designer Studio also offers some options in this regard. Using the Dashboards node in Designer Studio, users can create new dashboards, as well as name and describe them (Name and Description). Additionally, you can use the Configuration button here to open the dashboard configuration window in Portal.
Creating application dashboard
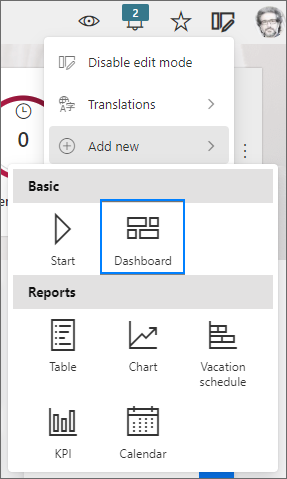
To create an application dashboard, click the Application Home button on the side panel and enable edit mode. Next, click the Edit button again, select Add new node, and choose the Dashboard option.
After selecting this option, the dashboard configuration window opens. Here, you can change the default dashboard name and configure it using one of the three available tabs.
Adding dashboard section and selecting its layout
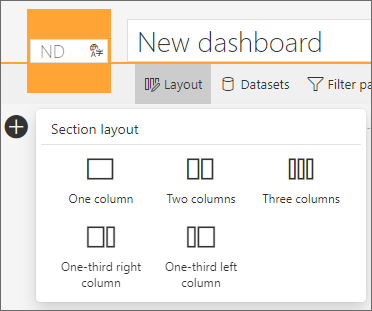
The Layout tab allows you to add a properly arranged dashboard section where you can embed various elements. You can select a section layout by clicking the plus button on the right side of the dashboard and choosing from the five options available in the Section layout menu. (It is possible to add multiple sections with different layouts within one dashboard.)
Embedding elements within a dashboard section
With dashboard section added, you can proceed to embed various elements within it. To do that, click the plus button visible in of the section segments and select the required option from the Add new element menu.
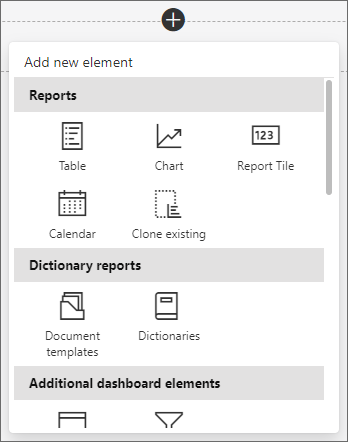
Below is a list of elements that you can embed on the dashboard using the Add new element menu. It includes their categories and a short description.
Reports
The dashboard allows you to embed reports that are independent of application reports. To create a new report, you need to define a data source for the dashboard or associate it with an existing one.
– Table – a report in the form of a table,
– Chart – a report in the form of a chart,
– Report Tile – a tile that displays specified information in a simplified form,
– Calendar – a report in a form of a calendar,
– Clone existing – the option allows you to clone an existing dashboard report, Report Tile, or application report. The cloning includes the complete configuration of the selected element, including the data source it utilizes (unless it is a report or report tile that belongs to the same dashboard).
The configuration window of a report created within a dashboard is slightly different from the configuration window of an application report. Although both windows generally contain the same options (excluding the capability to create private views in dashboard reports), they are arranged differently within tabs. This is demonstrated by the Definition tab, which allows you to configure both the data source and report columns. It is also worth noting an additional tab, Adjust Layout, which allows you to define a custom location for the report widget on the dashboard, and rearranged order of the tabs themselves.
If a visibility rule has been defined for a form field included in the report configuration, a corresponding message is displayed in the View configuration section (under the Definition tab) next to its corresponding column to inform users that this column may not be visible in the report.
By clicking the header of the report embedded in the dashboard, you can display it in full-screen mode.
Dictionary reports
– Document templates – contains a list of all document templates added by the application users. Along with the report, a dedicated data source is created for the dashboard unless the report is associated with a different source that matches its type and is available for the dashboard,
– Dictionaries – contains a list of dictionary elements added by users. Along with the report, a dedicated data source is created for the dashboard unless the report is associated with a different source that matches its type and is available for the dashboard.
Additional dashboard elements
– Start – allows you to add one of the configured Start buttons.
Data analysis and special reports
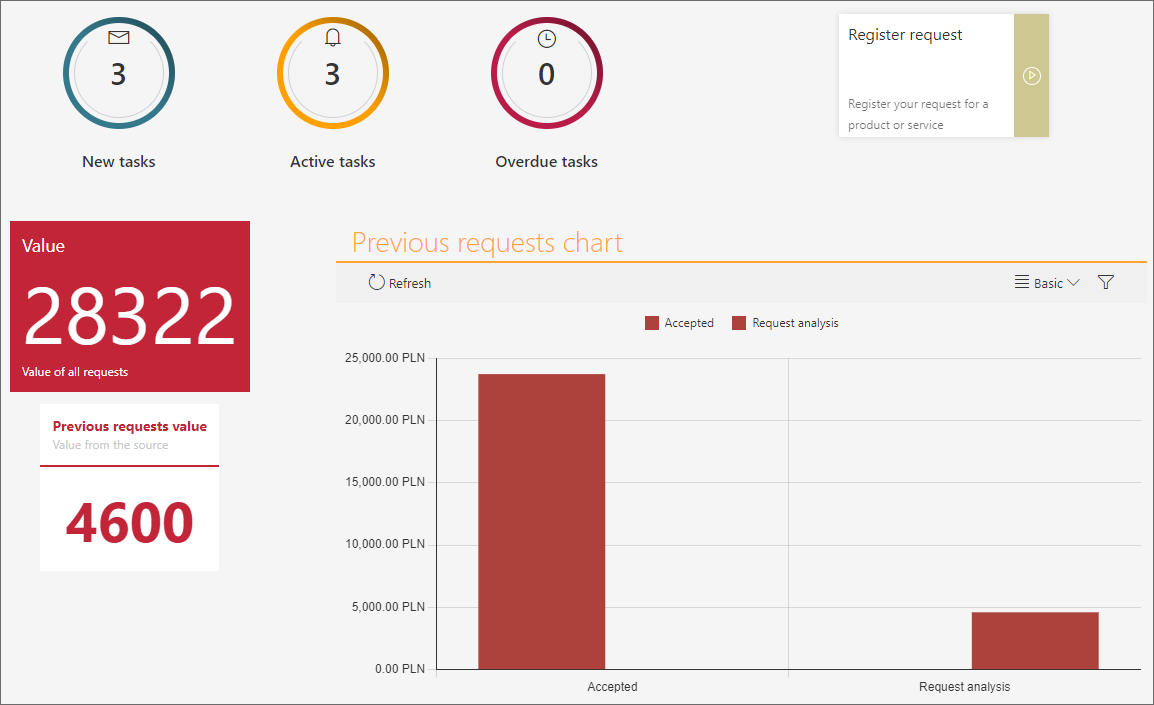
– Task Counter – displays information about tasks from the application (New tasks, Active tasks, Overdue tasks),
– KPI – displays aggregated values from a given field. For this report type, the Search panel and Mass actions tabs are not available,
– Vacation schedule – a tabular report that presents a summary of vacation days. Its configuration window does not include the User privileges tab,
– Performance indicators – a widget that presents data from performance indicators that are configured within the application,
– Power BI – allows users to display a Power BI report. For Power BI reports to work properly within the WEBCON BPS Portal, it is necessary to provide the correct application ID in the System settings.
To learn more about the Power BI reports, read the ARTICLE available in the WEBCON Community website
Text, media and content
– Text – a text field that provides various formatting options,
– Image – allows you to provide a link to an image,
– Embedded element – allows you to insert an object that redirects to a website, e.g., a table written in HTML, YouTube video, or an RS report,
– HTML code – enables you to insert an HTML code.
Miscellaneous
– Refresher – automatically refreshes the dashboard in the selected time interval,
– Find instance – allows searching for an element by its ID, number, or both,
– Application description – a short description of an application,
– Recent activities – displays recent activities,
– Application supervisor – displays the application's supervisor,
– Suggested reports – displays suggested reports,
– Act on behalf – allows one user to perform tasks on behalf of another.
For each dashboard column, you can change the vertical alignment of the embedded elements to position them on top or in the center of the column. You can place any number of elements in a column.

If you want to move an element to a different column or section, or rearrange elements, hover over the element you want to move. A menu with three options will appear on the right. Click and hold the middle button in the menu to drag and drop the element to the desired location on the dashboard.
To configure the custom location of an element within the column section, i.e. set its position relative to other dashboard elements, click the pencil button. In the newly opened element configuration window, navigate to the Adjust layout tab. Here, you can define the individual margins of an element by inputting their values in pixels.

Dashboard data sources
Users can create data sources assigned directly to dashboards and manage them. These data sources can then be reused to populate various reports embedded on the dashboard.
-
Creating a data source for a dashboard
Users can create a data source for a dashboard while creating a report (except for KPI and Vacation Schedule reports which do not utilize data from data sources). After selecting the report type from the Add new element menu, the Select dataset for report or report tile menu appears.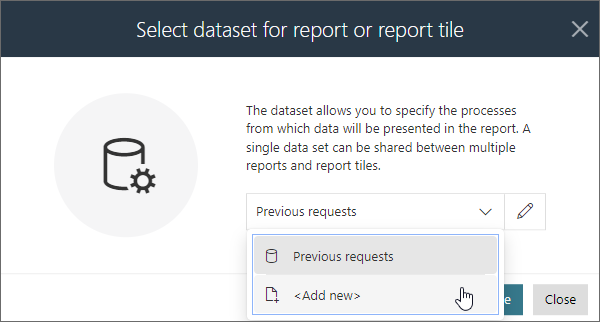
The window allows you to associate the created report with an existing data source (selectable from a drop-down list and configurable by clicking the pencil button) or create a new one by selecting the Add new option from the drop-down list. The type of data source depends here on the selected report type.
infoUnlike data sources created for application reports, the dashboard data source does not allow users to specify the number of rows displayed per one report page. This option is only available in the dashboard report configuration window.
infoIf a visibility rule has been defined for a form field included in the data source configuration, a corresponding message is displayed in the Dataset columns section (under the Columns tab) next to its corresponding column to inform users that this column may not be visible in the report.
-
Managing dashboard data sources
You can manage the data sources created within the dashboard using the Datasets tab in the dashboard configuration window. The configuration of the selected data source is possible in the right section of the window. Both the tabs and options available here correspond with the tabs and options visible when creating the data source.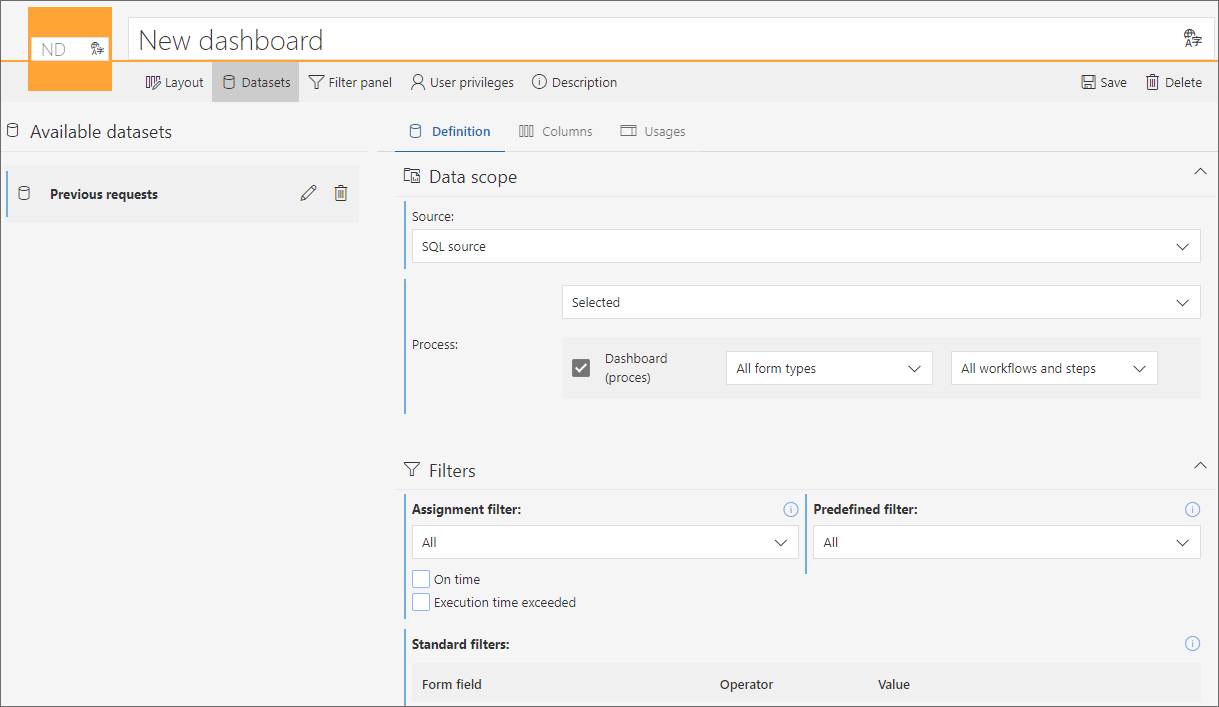
Privileges to display dashboard
The User privileges tab contained within the dashboard configuration window allows you to specify users or groups who are able to display a given dashboard. By default, the Visibility field for each newly created dashboard is set to Inherited from application. However, users can break the inheritance setting by selecting Custom from the drop-down list. Afterward, clicking the Add button allows you to specify users or groups who are able to display the dashboard.

To learn more about dashboards, read the ARTICLE available on the WEBCON Community page.